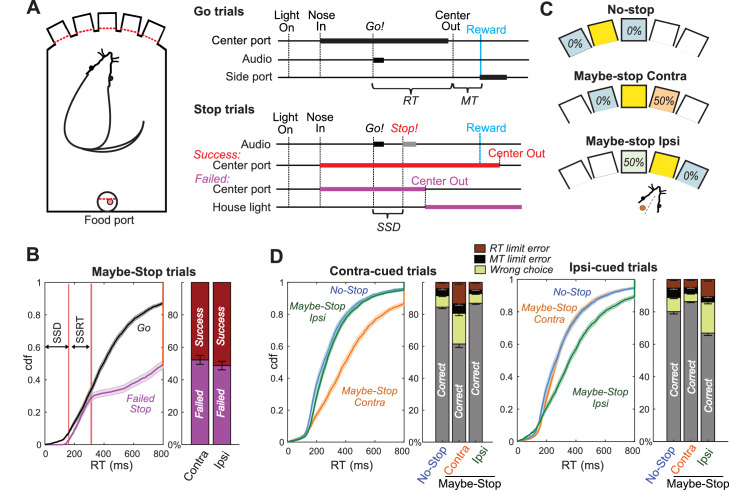
Figure 1. Reactive and Proactive Behavioral Inhibition.
(A) Left, operant box configuration; right, event sequence for Go and Stop trials. RT, reaction time; MT, movement time; SSD, stop-signal delay; Reward, delivery of a sugar pellet to the food port. (B) Left, distributions of Go and Failed-Stop RTs (on Maybe-Stop trials; shading, S.E.M. across n = 63 sessions). Failed-Stop RTs are similar to the faster part of the Go RT distribution, consistent with the ‘race’ model in which a relatively-fast Go process produces failures to stop. The tail of the Failed-Stop distribution (RT >500 ms) is presumed to reflect trials for which rats successfully responded to the Stop cue, but then failed to maintain holding until reward delivery (see Leventhal et al., 2012; Schmidt et al., 2013; Mayse et al., 2014). Right, proportions of failed and successful Stop trials after Contra and Ipsi Go cues. Error bars, S.E.M. across n = 63 sessions. (C) Trial start location indicates stop probabilities (locations counterbalanced across rats). In this example configuration recording from left GP, starting from the middle hole indicates the Maybe-stop Contra condition: Go cues instructing rightward movements might be followed by a Stop cue, but Go cues instructing leftward movements will not. (D) Proactive inhibition causes selective RT slowing for the Maybe-Stop direction (two-tail Wilcoxon signed rank tests on median RT for each session: contra cues in Maybe-Stop-contra versus No-Stop, z = 7.7, p=1.15 × 10⁻¹⁴; ipsi cues in Maybe-Stop-contra versus No-Stop, p=0.32). Additionally, under selective proactive inhibition rats were more likely to fail to respond quickly enough (RT limit errors; Wilcoxon signed rank tests, z = 7.2, p=5.41 × 10⁻¹³) and to select the wrong choice (uncued action direction; Wilcoxon signed rank tests, z = 7.0, p=2.59 × 10⁻¹²). Error bars, S.E.M. across n = 63 sessions. Only trials without a Stop cue are included here. RT limit error = Nose remained in Center port for >800 ms after Go cue onset; MT limit error = movement time between Center Out and Side port entry >500 ms.


