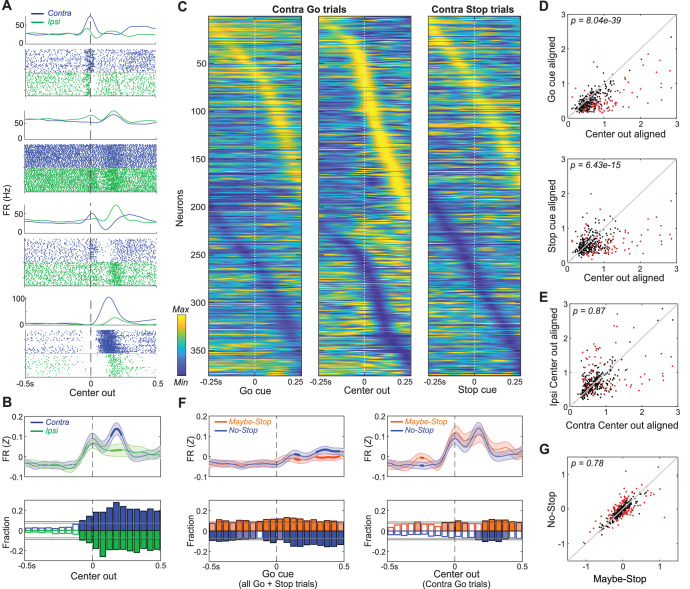
Figure 2. Movement-related activity of individual GP neurons.
(A) Four examples of single neurons, showing average firing rates (top) and spike rasters (bottom) aligned on movement onset (Center Out; correct No-Stop trials only). Activity for contra-, ipsi- movements are shown in blue and green respectively. (B) Top, averaged, Z-scored firing of GP cells around Center Out; time points when activity distinguishes movement direction are shown with thicker lines. Shaded band, +- S.E.M across n = 376 neurons. Bottom, fraction of neurons whose firing rate significantly distinguishes movement direction, across time (t-test for each neuron in each 50 ms bin, p<0.05). Higher firing rate for contra-, ipsi- shown in blue, green respectively. Horizontal grey lines indicate thresholds for a significant proportion of neurons (binomial test, p<0.05 without or with multiple-comparisons correction respectively) and bins that exceed these thresholds are filled in color. Many GP cells encoded movement direction even before Center-Out; this is less obvious after averaging. (C) Firing pattern of all GP cells (n = 376) on correct contra trials. Activity is scaled between minimum and maximum firing rate across alignments to Go cue (left), Center Out (middle) and the Stop cue (right). In each column cell order (top-bottom) is sorted using the time of peak deflection from average firing, separately for cells that showed bigger increases (top) or decreases (bottom). (D) GP population activity is more related to movements than cues. Scatter plots show peak deflections in firing rate (Z-scored) for each GP cell, comparing Center Out aligned data to Go cue aligned (top) or Stop cue aligned (bottom). Data included are 500 ms around alignment time. Indicated p-values are from Wilcoxon signed rank tests over the GP population; individual GP cells that showed significant differences are indicated with red points (t test, p<0.05). (E) Scatter plot indicates no overall movement direction bias. Same format, same statistical tests as D, but comparing peak deflections in Center Out aligned firing rate for contra, ipsi movements. (F) Top, comparing average firing between Maybe-Stop and No-Stop conditions. On left, data are aligned on Go cue, including all Maybe-Stop-Contra trials (including both contra- and ipsi-instructing Go cues and Stop trials). On right, data are aligned on Center-Out (and does not include Stop cue trials). Bottom, proportion of neurons whose firing rate is significantly affected by proactive inhibition (same format as B; bins exceeding p<0.05 threshold without multiple comparisons correction are filled in light color, bins exceeding corrected threshold are filled in dark color). Although GP neurons significantly distinguished Maybe-Stop and No-Stop conditions at multiple time points before the Go cue, there was no single time point at which the proportion of individually-significant neurons became large. (G) Comparison of individual cell activity in Maybe-Stop and No-Stop conditions, during the 500 ms epoch immediately before the Go cue.


