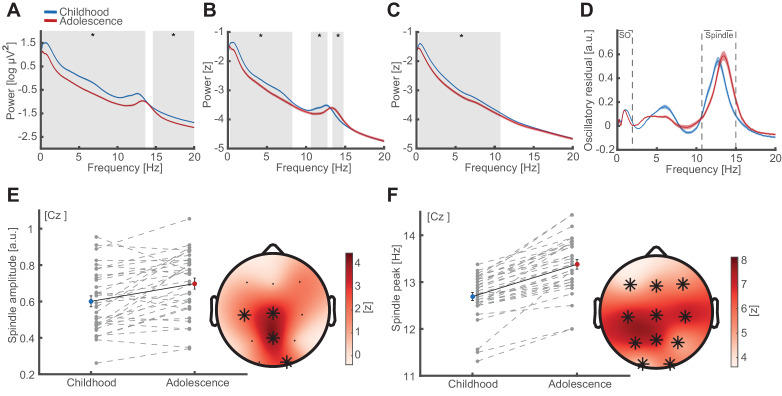
Figure 2. Oscillatory signatures of NREM sleep.
(A) Uncorrected EEG power spectra (mean ± standard error of the mean [SEM]) during NREM (NREM2 and NREM3) sleep at Cz during childhood (blue) and adolescence (red). Grey overlays indicate significant differences (cluster-corrected). Note the overall power decrease from childhood to adolescence. (B) Z-normalized EEG power spectra. Same conventions as in (A). Significant differences indicate a change in the fractal component of power spectra (0.3–8.4 Hz) and a spindle frequency peak shift (10.6–14.8 Hz) from childhood to adolescence. (C) Extracted 1/f fractal component. Same conventions as in (A). Decrease of the fractal component (0.3–10.8 Hz) from childhood to adolescence. (D) Oscillatory residual of the NREM power spectra obtained by subtracting the fractal component (C) from the z-normalized power spectrum (B). Oscillatory residual shows clear dissociable peaks in the SO and sleep spindle frequency range (dashed boxes) during both time points, indicating true oscillatory activity. (E) Spindle amplitude development. Spindle amplitude (exemplary depiction at Cz, left, mean ± SEM) as extracted from the oscillatory residuals (D) indicating an increase in 1/f corrected amplitude within a centro-partial cluster (right) from childhood to adolescence. Grey dots represent individual values. Asterisks denote cluster-corrected two-sided p<0.05. T-scores are transformed to z-scores to indicate the difference between childhood and adolescence. (F) Spindle frequency peak development. Spindle frequency peak (mean ± SEM) as extracted from the oscillatory residual (D). Same conventions as in (E). Spindle peak frequency increases at all electrodes from childhood to adolescence.


