(
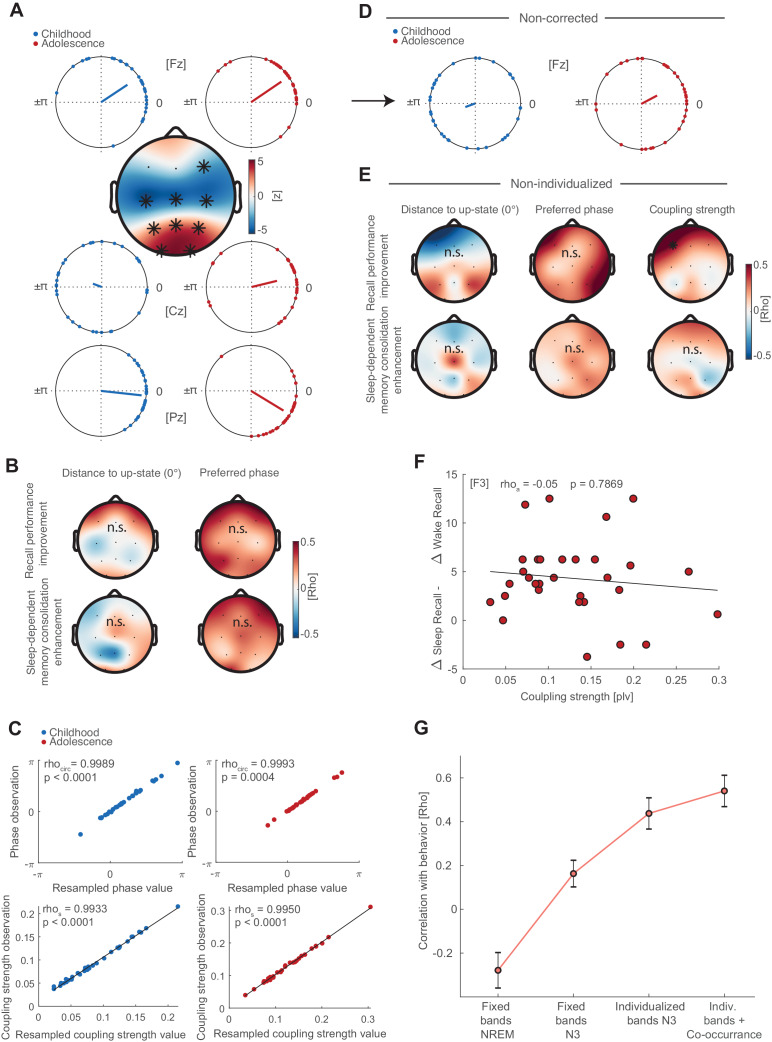
A) Preferred phase development from childhood to adolescence. Circular plots of preferred phase (SO phase at spindle amplitude maximum) per subject during childhood and adolescence at electrodes Fz, Cz and Pz. The dots indicate the preferred phase per subject. Circular plot are for descriptive purposes only because circular statistics (Watson Williams Test) were not applicable for repeated measures. At Fz, spindles are locked to and shortly after (falling flank) the positive SO peak (‘up-state’) during childhood (33.5°±44.8°;circular mean ± SD) and adolescence (34.2°±35.8°; circular mean ± SD). During childhood subject did not express a specific coupling direction at Cz (159.6°±72.1°) as indicated by the wide spread on the unit circle. However, spindles became locked to the SO-peak during adolescence (13.7°±52.9°). At Pz, spindles were coupled around the SO-peak during childhood (−6.2°±25.8°) and shortly before the SO-peak at the rising flank of the oscillation during adolescence (−31.3°±32.9
°). Topographical plot: We transformed circular measures (phase) to parametric values by calculating the absolute distance to 0° (i.e. SO ‘up-state’) to allow for repeated measure testing. Cluster-corrected dependent t-tests showed that subjects decreased the coupling distance to the SO-peak in a fronto-central cluster (p<0.001, d = −0.84) but increased the coupling distance in parieto-occipital cluster (p<0.001, d = 0.74). Indicating that spindles become increasingly locked to the SO up-state centrally but less so at parieto-occipital sites throughout development. (
B) Left: Cluster-corrected correlations between the developmental changes in distance to up-state (adolescence – childhood) with difference in recall performance (delayed recall
adolescence – delayed recall
childhood; top row) and difference in sleep-dependent memory consolidation ([delayed recall
adolescence – immediate recall
adolescence] - [delayed recall
childhood – immediate recall
childhood]); bottom row). No significant clusters emerged. Right: Cluster-corrected circular linear correlation between change in preferred phase (calculated as distance between preferred phase during adolescence and childhood) and behavior. No significant clusters emerged. (
C) To control for differences in event number, we used bootstrapping by randomly drawing 500 spindle events 100 times and recalculating the preferred phase and coupling strength. Scatter plots depict spearman correlations (coupling strength) and circular-circular correlations (phase) for observed and resampled coupling metrics during childhood (blue) and adolescence (red). The strong correlations show that the coupling metrics where not influenced by differences in event number between childhood and adolescence. (
D) Circular plots for non-corrected (NREM), non-individualized (fixed spindle band 11–15 Hz, SO <1.25 Hz) phase estimates at electrode Fz. Note the strong spread of individual preferred phase compared to individualized and corrected circular plot in (A). (
E) Cluster corrected correlations of non-individualized coupling metrics (fixed bands) during NREM3 with behavior (difference in recall performance, top row; difference in sleep-dependent memory consolidation, bottom row) for preferred phase and distance to up-state difference. No significant clusters emerged. Note that the predictive power of a frontal coupling strength increase for recall performance improvement (
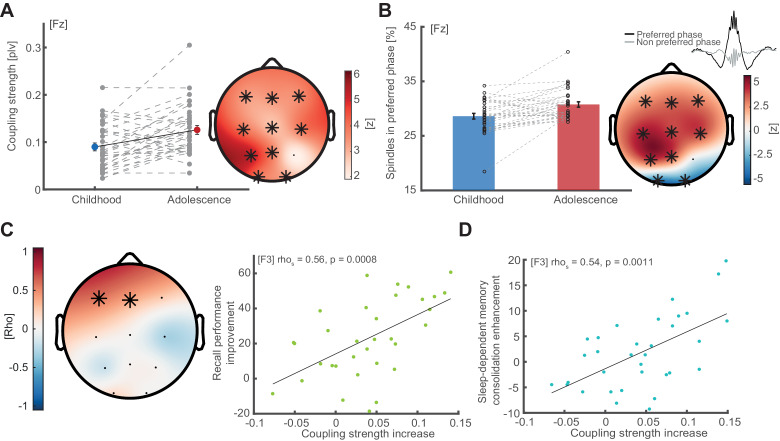
Figure 4C) declined (rho = 0.50, p=0.035; cluster-corrected) and vanished for sleep-dependent memory consolidation enhancements (
Figure 4D) for non-individualized (bottom row, right) coupling metrics when accounting for factors that impair accurate cross-frequency coupling estimation (
Aru et al., 2015). (
F) Correlation analysis between coupling strength at F3 and the difference of memory consolidation between the sleep and wake condition during adolescence ([(delayed recall
sleep –immediate recall
sleep)- (delayed recall
wake –immediate recall
wake)]). This analysis was conducted in order to validate whether the coupling strength is related to enhanced performance after sleep compared to a wake. (
G) Bootstrapped mean correlation coefficients (mean ± SEM) of sleep-dependent memory enhancement and coupling strength increase at F3 as a function of analytical choice. Mean and SEM of the correlation coefficients were obtained via a bootstrapping procedure by computing the correlation 1000 times for ~90% (N = 27) randomly drawn subjects. The obtained values were first Fisher Z-transformed to calculate the mean and SEM and subsequently retransformed to rho-values. Note the increase for every analytical choice, which reveals the necessity for controlling for individual oscillatory signatures and event co-occurrence.


