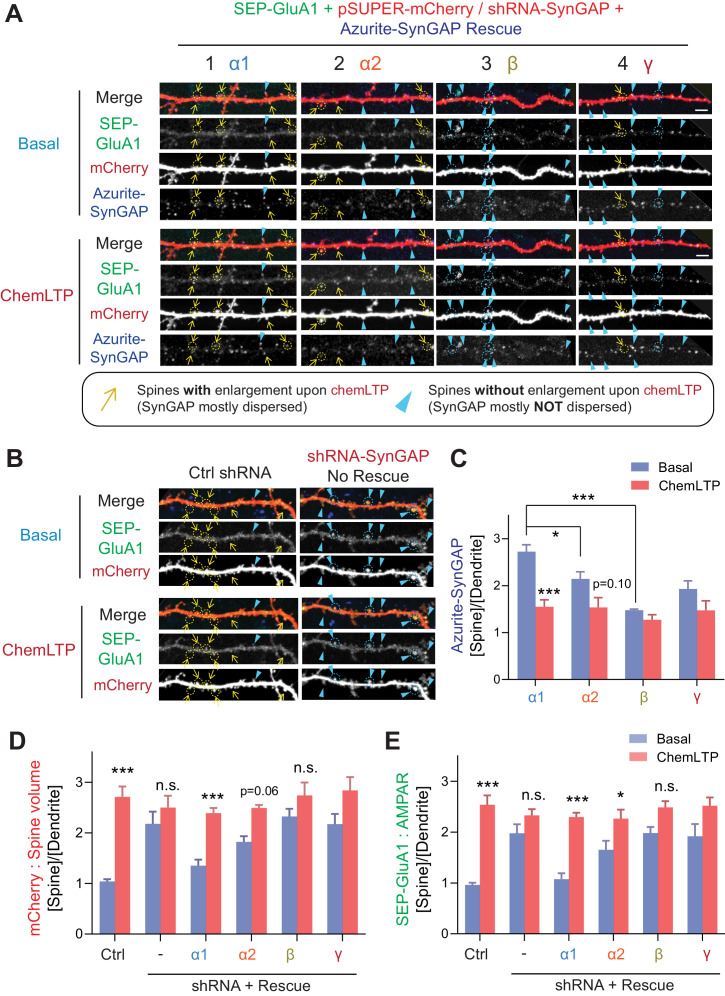
Figure 6. SynGAP-α1 rescues AMPA receptor trafficking and structural plasticity deficits in SynGAP-depleted hippocampal neurons.
(A, B) Representative live confocal images of cultured hippocampal neurons expressing SEP-GluA1, mCherry, and individual Azurite-tagged SynGAP isoforms in basal and chemLTP conditions. Endogenous SynGAP was knocked-down and replaced with individual Azurite-tagged SynGAP isoforms. Yellow arrows indicate dendritic spines that exhibited LTP-induced enlargement. Scale Bar, 5 μm. (C–E) Quantification of averaged SEP-GluA1, mCherry, Azurite-SynGAP intensity in dendritic spines on hippocampal neurons expressing individual SynGAP isoforms before and after chemLTP treatment. Error bars indicate ± SEM. Two-way ANOVA followed by Tukey's post hoc test (ChemLTP F(1,242) = 501.1 [GluA1], 426.4 [mCherry], 219.4 [SynGAP], p<0.001; Genotype F(5,242) = 30.68 [GluA1], 35.71 [mCherry], 553.7 [SynGAP], p<0.001; Interaction (5,240)=15.02 [GluA1], 18.57 [mCherry], 553.7 [SynGAP], p<0.001; n = 47–49 spines from 4 independent coverslips each condition, ***p<0.001, **p<0.01, *<0.05) was performed. Error bar indicates ± SEM.

