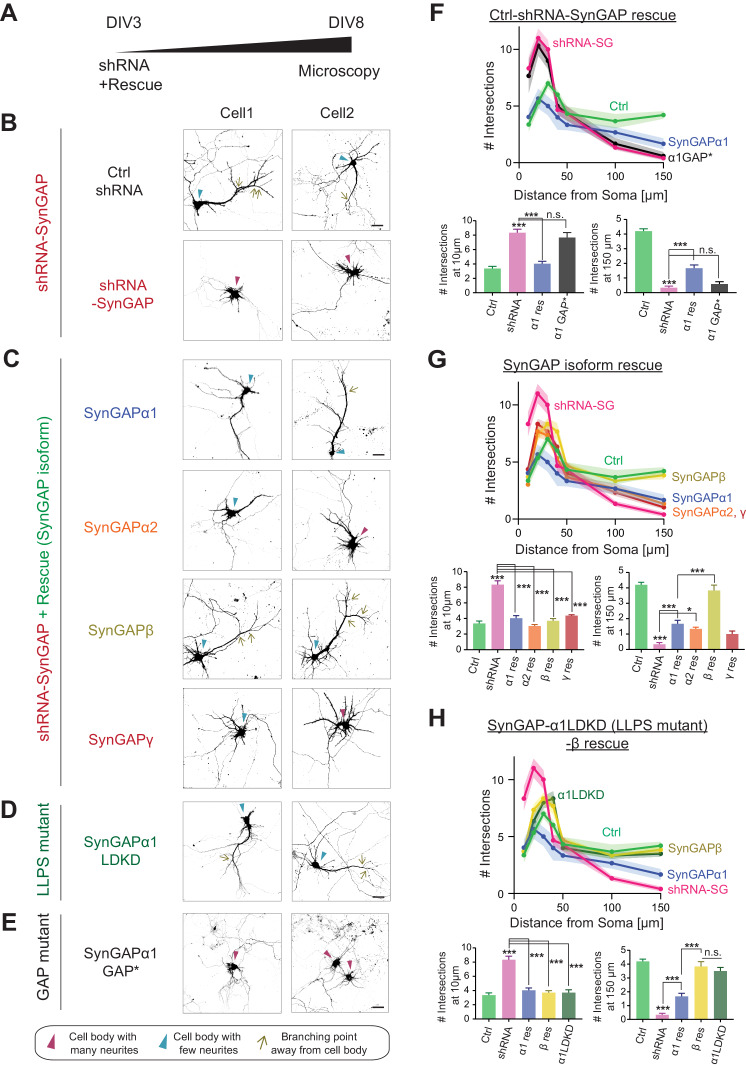
Figure 7. SynGAP-β rescues aberrant dendritic arbor development in SynGAP-depleted neurons.
(Α) Schematic of experimental timeline for assessing the effects of individual SynGAP isoform expression on dendritic development. Neuronal morphology was evaluated by observing co-transfected DsRed at DIV 8. (Β-E) Representative images of dendritic arbors of young cultured hippocampal neurons expressing DsRed upon SynGAP knockdown (B) and upon SYNGAP1 knockdown plus expressing individual SynGAP isoforms (C), SynGAPα1 LLPS mutant (D), or SynGAPα1 GAP mutant (E). Scale Bar, 20 μm. (F–H) Sholl analysis of dendritic branches presented as the mean number of intersections plotted as a function of distance from the center of the cell body (center = 0). Error bars indicate ± SEM. Two-way ANOVA followed by Tukey's post hoc test (Distance F(6,952) = 288.6, p<0.001; Genotype F(7,952) = 21.96, p<0.001; Interaction (42,952)=14.83, p<0.001, n = 18) was performed. Error bar indicates ± SEM.

