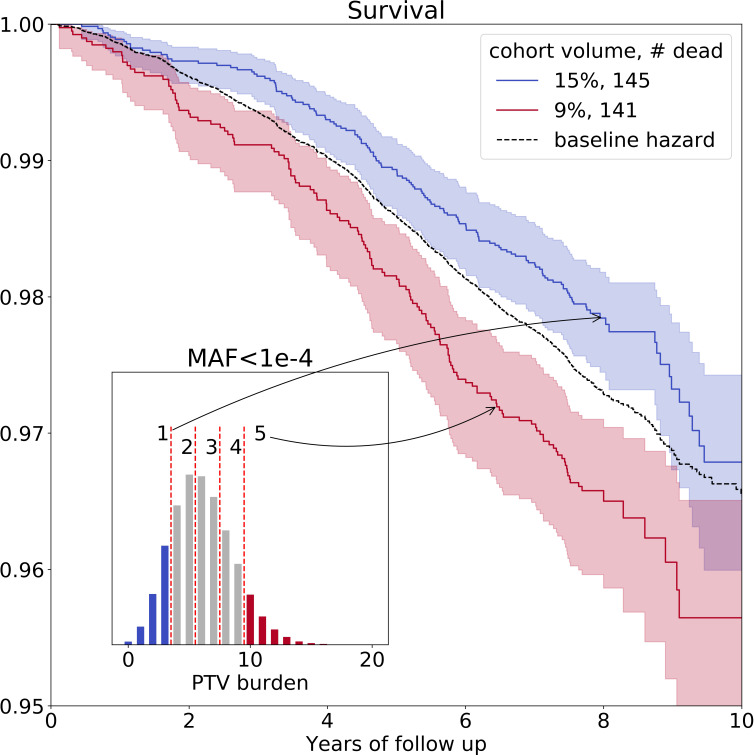
Figure 2. Ultra-rare () PTV burden distribution and survival curves for the deceased UKB subjects stratified into groups based on the increasing burden.
Blue line represents survival of individuals with low PTV burden (3 or less ultra-rare PTVs per genome) and red line represents survival of individuals with high PTV burden (10 or more ultra-rare PTVs per genome) during eleven years of follow-up (log-rank test ). The absolute number of deceased subjects in each line, and the corresponding percentage, is indicated in the legend. The inset shows the distribution of the number of ultra-rare () PTVs per deceased individual in UKB cohort, colored accordingly to the survival curves. MAF - minor allele frequency, PTV - protein-truncating variants (defined as stop codon gains, frameshifts, canonical splice acceptor/donor sites variant).

