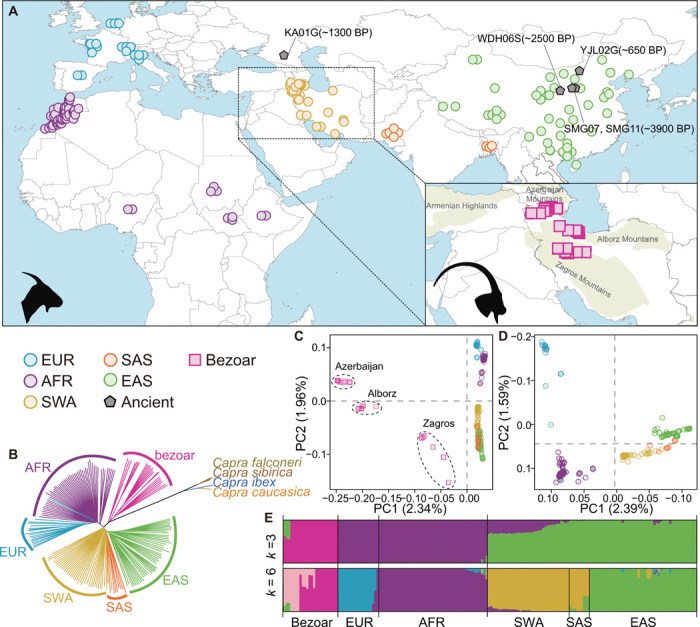
Fig. 1. Geographic distribution and genetic affinities of wild and domestic goats used in this study.

(A) Locations of wild (squares), domestic (circles), and ancient (pentagon) goats for each major geographic group. Domestic goats are colored to mirror their geographic origin. BP, before the present. (B) A neighbor-joining tree from the genome sequences used in this study. The branches are colored following the same color code used in (A). (C and D) PCA of bezoars and domestic goats (C) and domestic goats only (D). (E) ADMIXTURE results for k = 3 and k = 6, which had the low cross-validation error.
