
Fig. 4. Biasing nature of the effects.
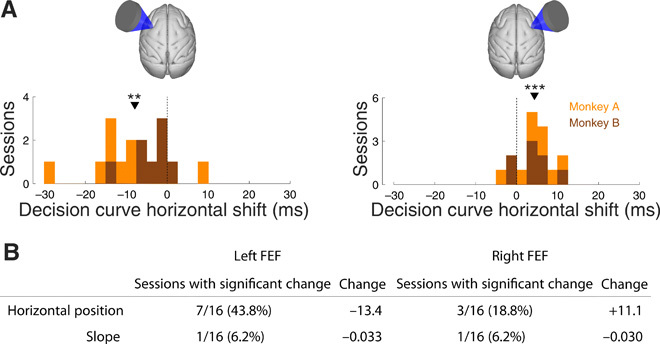
(A) The amount of horizontal shift of the decision curves by ultrasound (blue versus black in Fig. 2A). The data are presented separately for left and right FEF stimulation sessions (left and right panels) and separately for each session in each animal (effect histogram). The orange (brown) counts correspond to sessions of monkey A (B) and the counts are cumulative (no overlap of the orange and brown histograms). The asterisks indicate the effect significance (two-sided t test; **P <0.01, ***P <0.001). (B) The table shows the number of sessions (left columns) in which the parameters fitted to each decision curve (rows) changed significantly during ultrasound stimulation. See Materials and Methods for details of the statistical test. The right column shows the average magnitude of the change over the significant sessions. Horizontal position is measured in milliseconds and slope is measured in per millisecond.