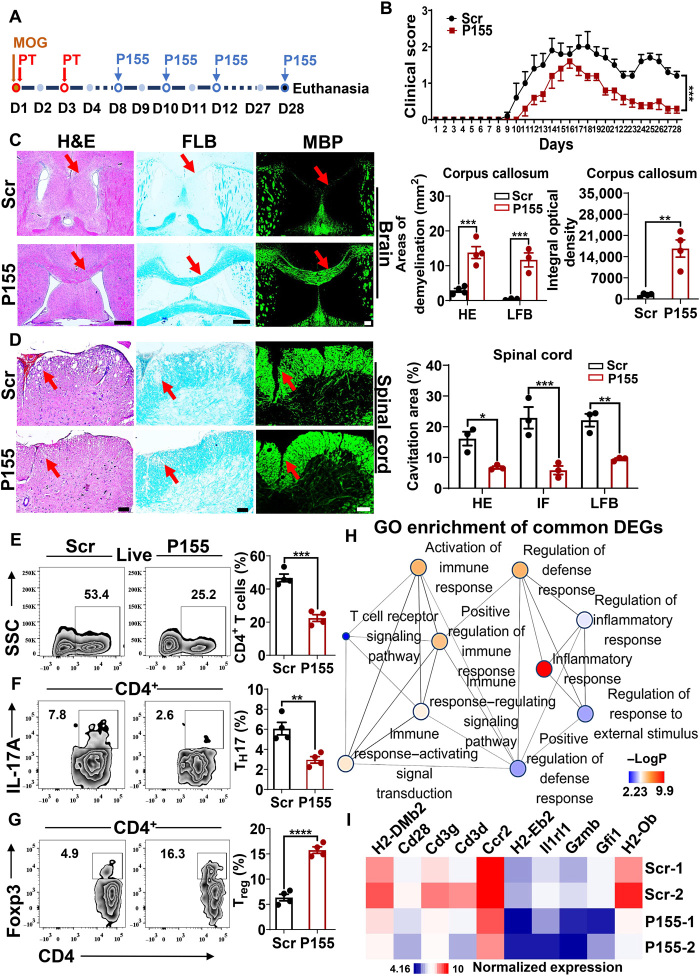
Fig. 5. P155 mitigates DC-dependent autoimmunity in the central nervous system.
(A) Schematic diagram of MOG-induced EAE. (B) Clinical score of Scr- or P155-treated EAE mice (n = 5). (C and D) Representative images of H&E, LFB, MBP staining, and statistical analysis for Scr- or P155-treated EAE mouse brain (C, left and right) and spinal cord sections (D, left and right). n = 3 to 4, red arrows indicate the demyelination. (E to G) Flow cytometric analysis of CD4+ T cell (E), TH17 cell (F), and Treg cell (G) percentages gated on CD4+ T cells from Scr- or P155-treated EAE mouse brain on day 15 after immunization (n = 4). (H) Pathway enrichment analysis of down-regulated DEGs in Scr- or P155-treated EAE mouse spinal cord on day 15 after immunization (n = 2). Color key represents the value of −logP; the size of the dot corresponds to the gene counts. (I) Heat map of selected genes based on RNA-seq data from the spinal cord of Scr- or P155-treated EAE mice on day 15 after immunization (P < 0.05, Log2FC < −1, n = 2). Color key represents the normalized expression of genes. Scale bars, 200 μm (C) or 100 μm (D). Data (C to G) are representative of three independent experiments. **P < 0.01; ***P < 0.001; and ****P < 0.0001, two-way ANOVA (B) and one-way ANOVA (mean ± SEM). Photo credit: Liman Niu (Shanghai Institute of Immunology, Shanghai Jiao Tong University School of Medicine).

