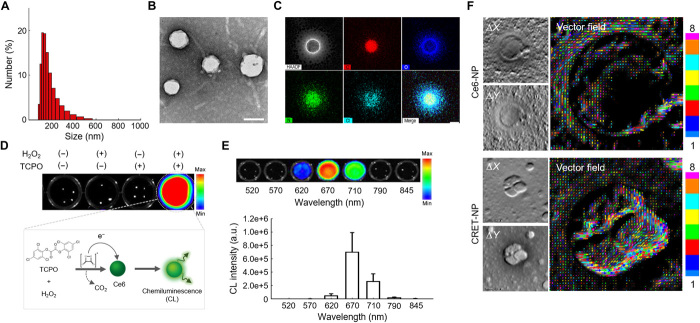
Fig. 2. Physicochemical characteristics of CRET-NPs.
(A) Size distribution of CRET-NPs. (B) TEM image of CRET-NPs. (C) EDS mapping of CRET-NPs. Atomic distribution shows colocalization of TCPO and Ce6 in the particle cores. Scale bar, 100 nm. (D) CL images of CRET-NPs in the presence of TCPO and/or H2O2. (E) CL images of CRET-NPs in the presence of H2O2 at different wavelengths of emission filter (top). Quantification of the CL signal from CRET-NPs (bottom). Error bars represent the SD (n = 3). a.u., arbitrary units. (F) DPC images (left) and vector field images (right) of Ce6-NPs and CRET-NPs. The vector field images through the Ronchigram show the presence and direction of electrons in the CRET-NPs.

