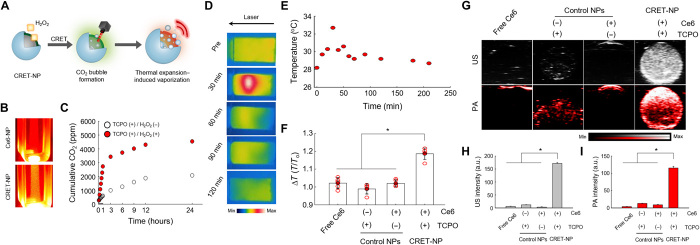
Fig. 3. TEIV behavior of CRET-NPs as the PA contrast agent.
(A) Schematic illustration of TEIV by CRET-NPs. (B) Photographs of Ce6-NPs and CRET-NPs. In the presence of H2O2, CRET-NPs generated a quantity of CO2 molecules. (C) Quantification of CO2 molecules in the presence or absence of H2O2. (D) In vitro thermography of CRET-NPs under laser irradiation. (E) Thermal heating curve of CRET-NPs as a function of laser irradiation time. (F) Photothermal effects of free Ce6, TCPO-bearing NP, Ce6-NP, and CRET-NPs (left to right). The y axis represents the ratio of initial temperature to maximum temperature. Error bars represent the SD (n = 5). *P < 0.0001, analyzed by one-way analysis of variance (ANOVA). (G) In vitro US and PA imaging of free Ce6, TCPO-bearing NP, Ce6-NP, and CRET-NPs (left to right). (H) Comparison of US intensities and (I) PA intensities for free Ce6, TCPO-bearing NP, Ce6-NP, and CRET-NPs. Error bars represent the SD (n = 3). *P < 0.0001, analyzed by one-way ANOVA.

