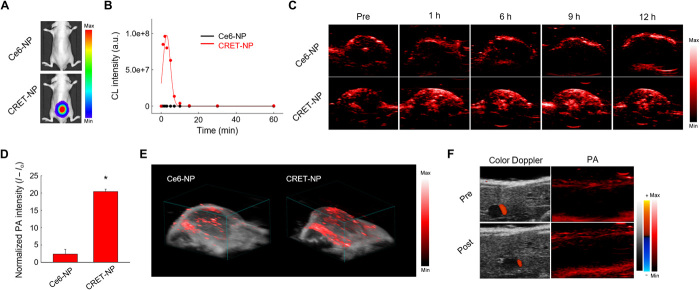
Fig. 4. In vivo PA imaging of CRET-NPs.
(A) Representative in vivo CL images of Ce6-NPs and CRET-NPs in the presence of H2O2. (B) CL kinetic profiles of Ce6-NPs and CRET-NPs. (C) Time-dependent PA imaging of the tumor site after systemic administration of Ce6-NPs and CRET-NPs. (D) Quantification of PA intensities of Ce6-NPs and CRET-NPs. Error bars represent the SD (n = 3). *P < 0.0001, analyzed by one-way ANOVA. (E) 3D-rendered PA images of Ce6-NPs and CRET-NPs. (F) Color Doppler images (left) and PA images (right) of liver tissues by CRET-NPs.

