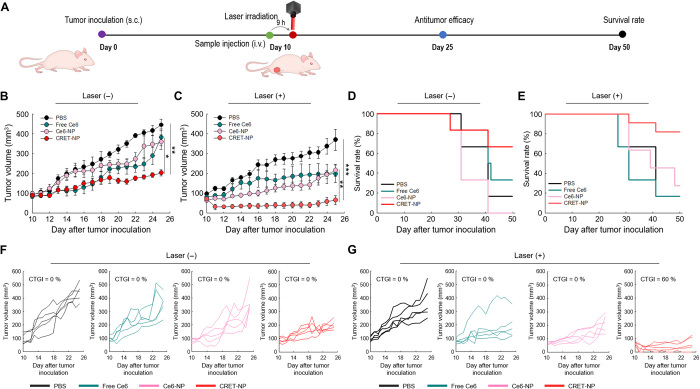
Fig. 6. In vivo therapeutic efficacy of PDT with CRET-NPs.
(A) Schematic illustration of the treatment regimen of CRET-NP–based PDT. i.v., intravenous; s.c., subcutaneous. (B and C) Changes in tumor volume by PDT after systemic administration of the samples at 5 mg/kg of Ce6 in HT29 tumor xenograft mice (B) without laser and (C) with laser (635 nm, 50 mW/cm2) treatment. Error bars represent the SE (n = 5). *P < 0.05, **P < 0.01, and ***P < 0.001, analyzed by one-way ANOVA. (D and E) Survival rate for each treatment group (D) without laser and (E) with laser treatment. (F and G) Individual tumor growth data and complete regression rate for each treatment group.

