
Fig. 3. Association with individual resistances.
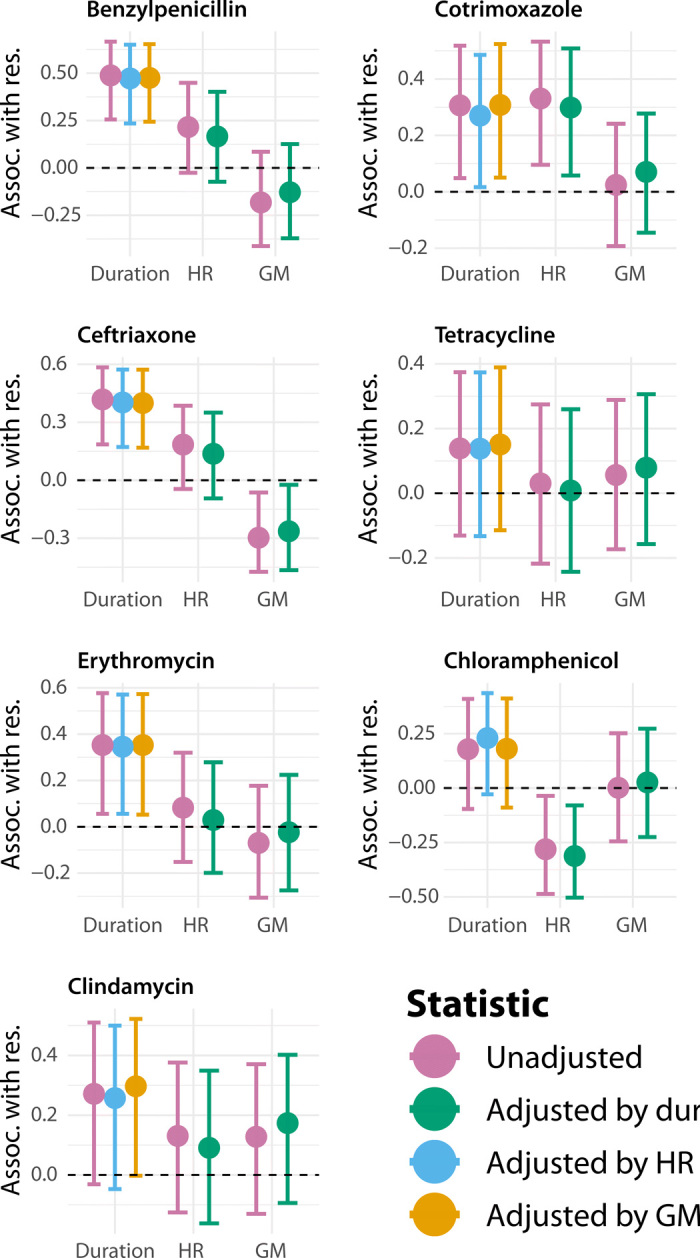
Kendall rank correlation (τ) between SC resistance to each antibiotic and duration of carriage (unadjusted and adjusted for HR or GM); SC resistance to each antibiotic and HR (unadjusted and adjusted for duration of carriage); and SC resistance to each antibiotic and GM (unadjusted and adjusted for duration of carriage). Opaque error bars represent 95% CIs, while transparent error bars represent 99% CIs; both were computed by bootstrapping (see the Supplementary Materials). SCs with fewer than five episodes of carriage were excluded, giving a sample size of 42 SCs.