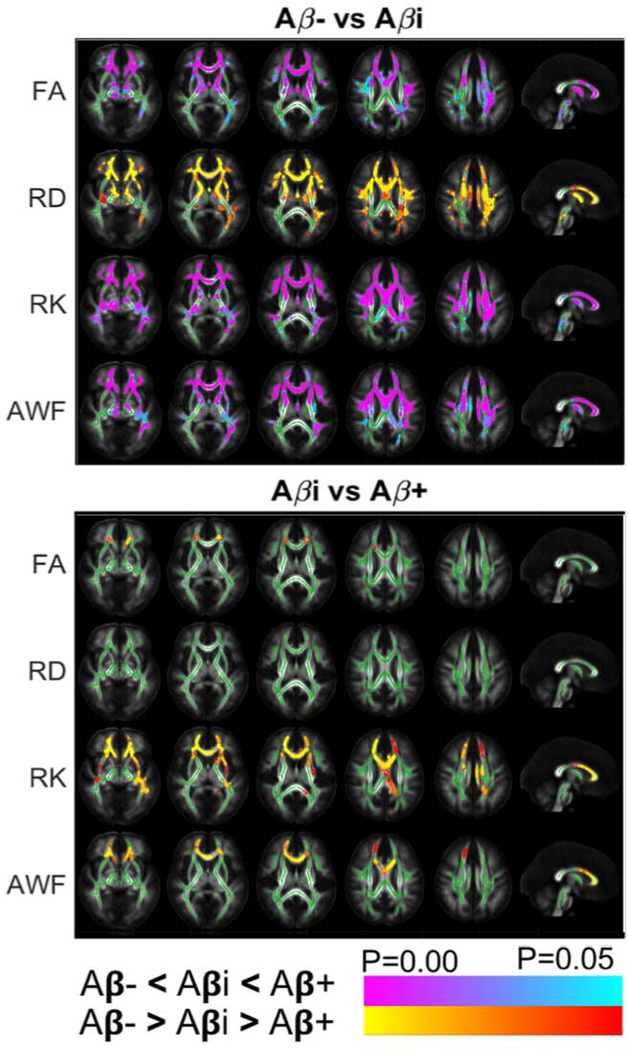
Figure 2:
TBSS Results: Axial and mid-sagittal views show significant differences between Aβ−/Aβi groups and Aβi/Aβ+ groups for FA (row 1), RD (row 2), RK (row 3), and AWF (row 4). Clusters of increased (red/orange) and lower (blue/purple) are overlaid on the FA template, together with the mean skeleton (green). The observed difference between Aβ−/Aβi comparison are in the opposite direction of those in Aβi/Aβ+ comparison. TBSS revealed significant differences involving the genu of the corpus callosum and the anterior corona radiata. Directions of changes are consistent as those observed in the ROI analysis.

