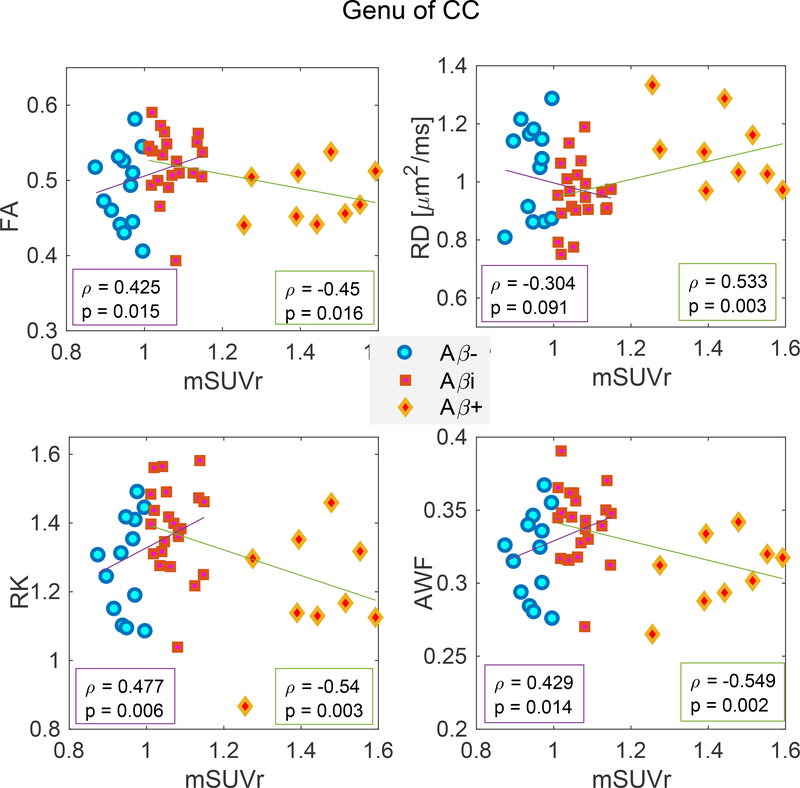
Figure 6:
Correlation analysis of diffusion metrics in the genu vs mSUVr in combined Aβ− and Aβi groups (cohort 1), and combined Aβi and Aβ+ groups (cohort 2), which demonstrate that correlation coefficients (corrected for age, sex and GDS) are significant and in opposite directions for the two cohorts. Each plot illustrates the correlation with mSUVr for FA (top left), RD (top right), RK (bottom left), and AWF (bottom right).

