
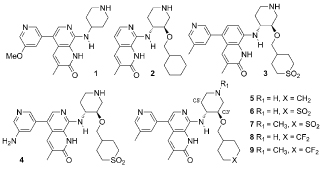
Table 1. Micromolar lead to nanomolar ATAD2 inhibitors. For statistics see Table S1a, Supporting Information.
 | ||||||||
|---|---|---|---|---|---|---|---|---|
| 2 | 3 | 4 | 5 | 6 | 7 | 8 | 9 | |
| ATAD2 TR-FRET pIC50 | 5.6 | 7.2 | 6.9 | 6.7 | 6.9 | 6.5 | 7.4 | 7.1 |
| ATAD2 Bromosphere pIC50 | 5.4 | 7.4 | 7.3 | 6.5 | 7.5 | 7.0 | 7.2 | 7.1 |
| BRD4 BD1 TR-FRET pIC50 | 5.4 | 5.4 | 5.0 | 5.8 | 4.8 | 4.1 | 5.2 | 5.1 |
| TR-FRET selectivity (logs) | 0.2 | 1.8 | 1.9 | 0.9 | 2.1 | 2.4 | 2.2 | 2.0 |
| Chrom logD (pH 7.4) | 3.3 | 2.1 | 0.4 | 4.0 | 1.6 | 2.3 | 3.0 | 4.1 |
| Polar surface area [Å2] | 79 | 113 | 152 | 92 | 126 | 117 | 92 | 83 |
| Artificial membrane permeability (nms−1, pH 7.4) | 130 | <3 | <3 | 138 | <3 | <10 | 86 | 395 |