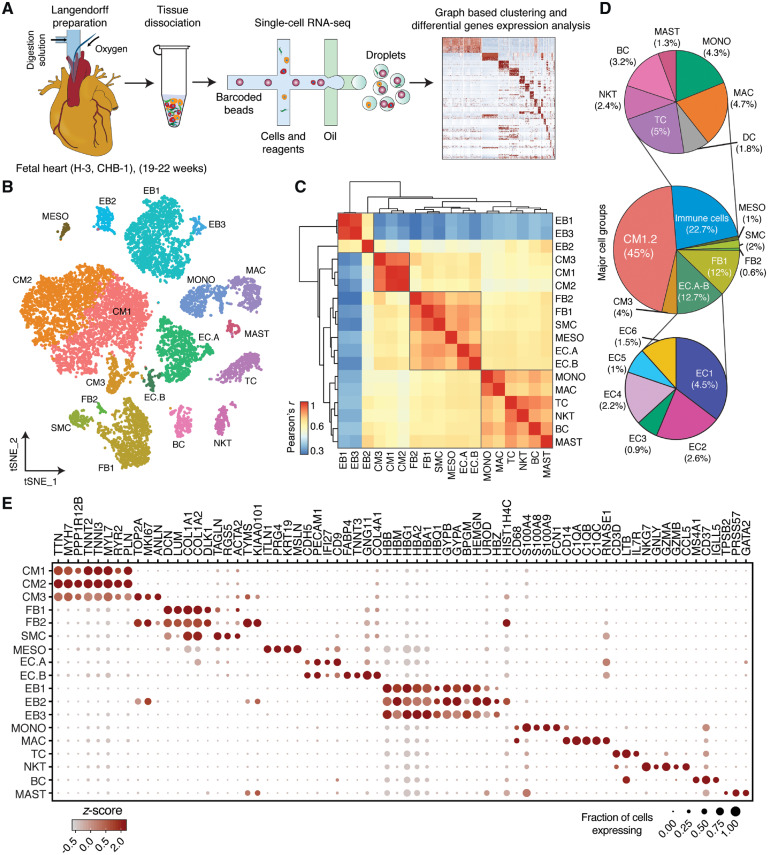
Figure 1.
Identification of cell types in human foetal heart. (A) Workflow for single-cell transcriptome profiling of foetal hearts. Numbers in parentheses indicate the number of healthy (H) and disease (CHB) samples analysed. (B) Clustering for 12 461 cells from three healthy samples based on established lineage markers and visualized using t-SNE. (C) Pearson’s correlation coefficient (r, for values see colour scale) comparing averaged gene expression of each cell type. (D) Averaged proportion of all cell types (except EBs) contributing to foetal human hearts. Middle panel indicates major cell groups with subgroups of immune cells (top panel) and endothelial cells (bottom panel) and number in parenthesis indicates percentage contribution to foetal heart cells. (E) Dot plots showing expression of known lineage markers and co-expressed lineage-specific genes.

