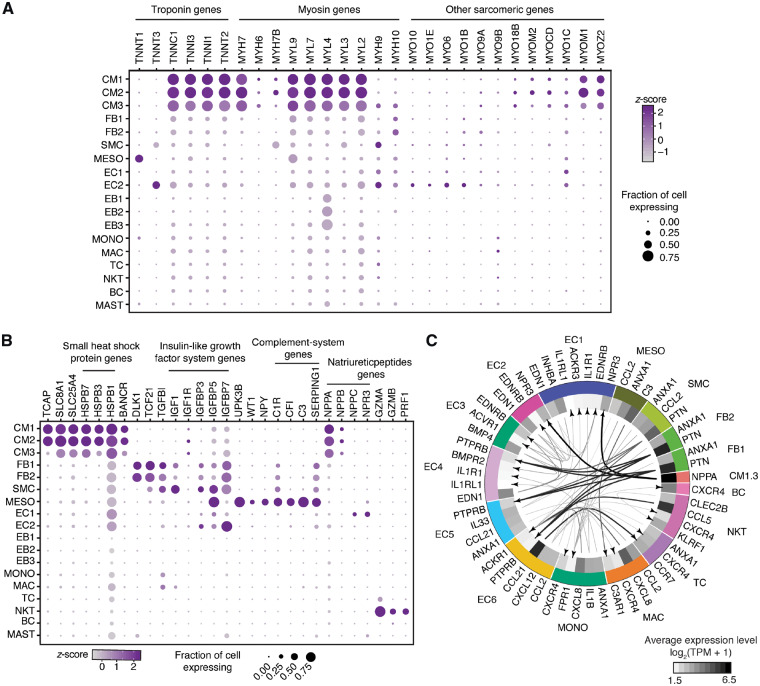
Figure 3.
Dot plots showing expression of selected genes. (A) Troponin, myosin and other sarcomeric genes expression in healthy heart cell types. (B) Expression of other important genes in major cell types of foetal heart. (C) Putative signalling within foetal heart cell types with size of the arrow stem proportionate to expression levels of the ligands. All the arrows are pointing to the receptors. Only ligands with >5 TPM and receptors with >1.8 TPM average expression were used for interaction analysis display. MDK–PTPRB interactions were excluded, and provided as a separate figure (Supplementary material online, Figure S2B).

