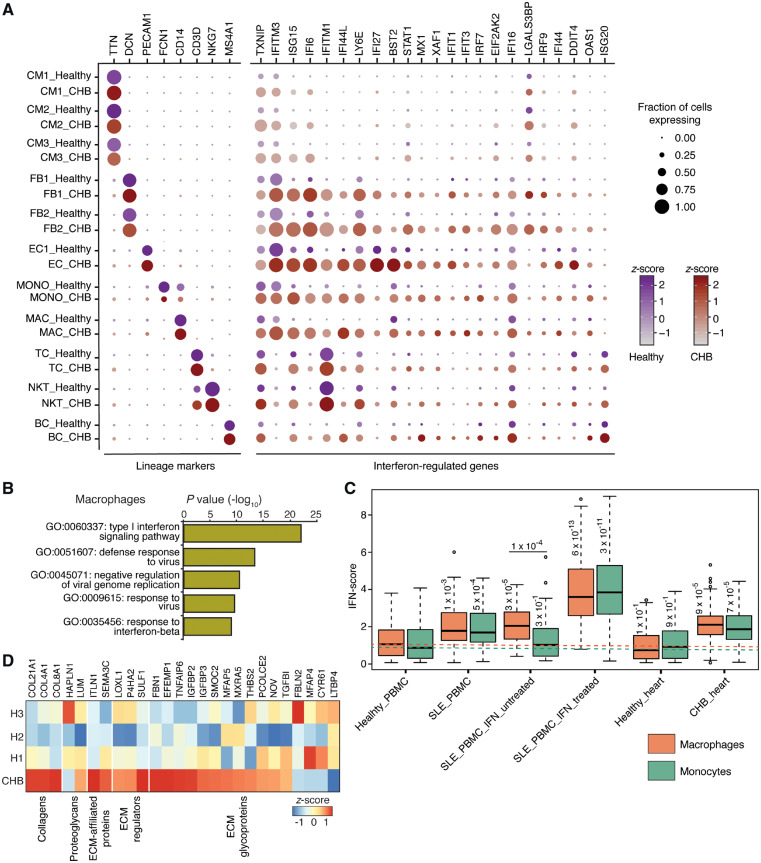
Figure 4.
Gene expression differences between healthy and CHB heart cell types. (A) Dotplot of lineage markers and differentially expressed IFN-regulated genes (Wilcoxon rank sum test, expressed by >30% of cells of a given cell type, log fold change >1.5 in at least one cell type) between healthy and CHB cell types. (B) Gene ontology (GO) terms enriched in DAVID analysis performed on the top 25 up-regulated genes of CHB macrophages. (C) IFN-score plot of macrophages and monocytes obtained from various sources including healthy and systemic lupus PBMCs in the absence and presence of treatment with exogenous IFN beta. The Healthy_PBMC data was acquired from 10x Genomics (see methods section) and SLE_PBMC data was obtained from Der et al. study48. Both the SLE_PBMC_IFN_untreated and treated datasets were acquired from Kang et al. study17. The Healthy_heart and CHB_heart macrophages and monocytes belong to the present study. Dotted lines highlight median IFN-score of macrophages (orange) and monocytes (green) obtained from PBMCs obtained from healthy donors. Numbers on the boxplots indicate P-values from a Wilcoxon rank sum test. (D) Heatmap showing differential expression and enrichment of matrisome genes between CHB and healthy (H1, H2, and H3) stromal cells (FB and SMC). Only genes with expression >1 TPM and fold change (CHB vs. healthy) of 1.5 TPM were considered for the analysis.

