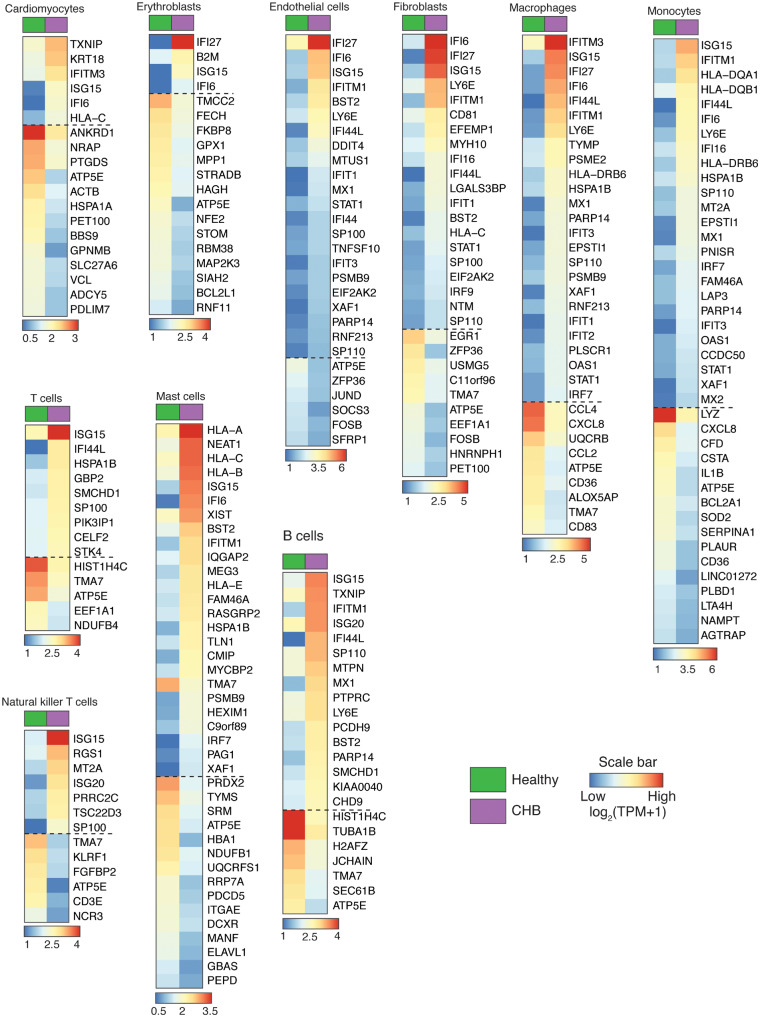
Figure 5.
Gene expression differences between healthy and CHB heart cell types. Heatmap reporting averaged expression level [log2(TPM + 1)] of differentially expressed genes (Wilcoxon rank sum test, >1.5 log fold change, expressed by >30% cells in a given cell type) between healthy and CHB cell types. Note that genes below the dashed line represent a subset of down-regulated genes of CHB vs. healthy cell types.

