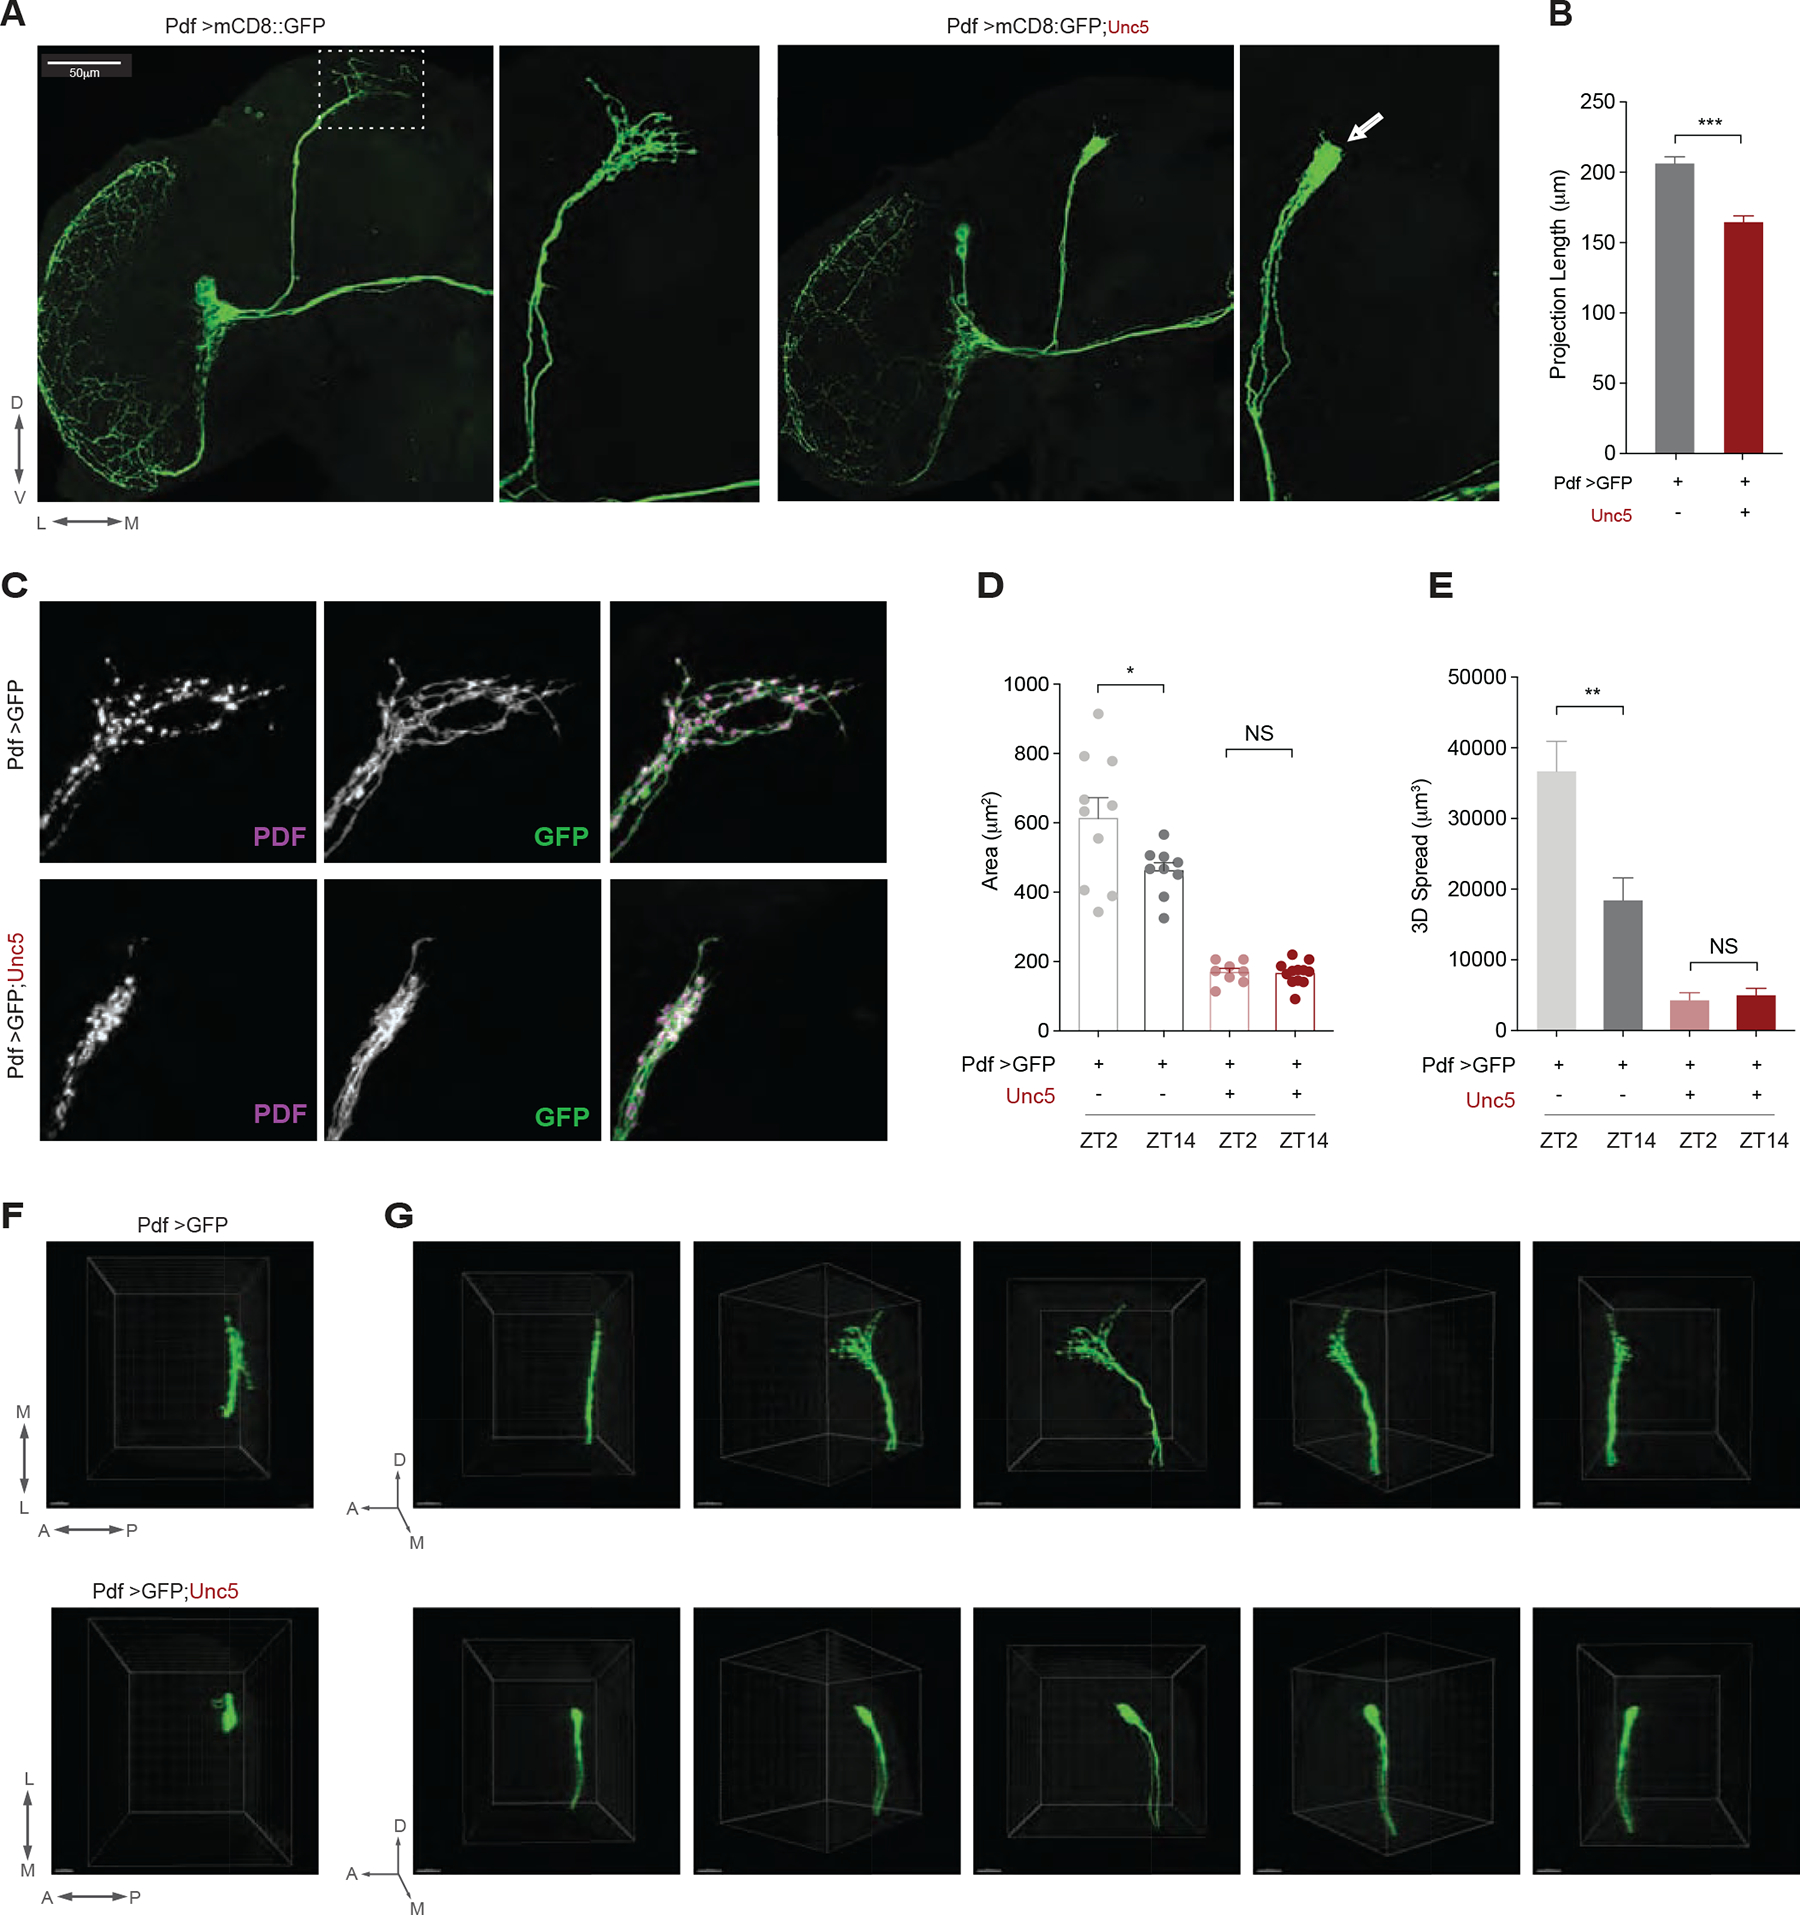
Figure 1. Overexpression of the axon guidance receptor Unc5 eliminates the dorsal arbor from the s-LNvs.

(A) Representative confocal images of an anti-GFP immunostaining showing the left hemispheres of a ;Pdf-Gal4/UAS-mCD8::GFP; (left panels) and ;Pdf-Gal4/UAS-mCD8::GFP;UAS-Unc5/+ (right panels) showing a hemisphere of the adult central brain (left sides) and a magnified image of the s-LNvs projections extending into the dorsal protocerebrum (right sides). Scale bar 50μm. Dorsal, ventral, medial, and lateral directions indicated below the left panel. l-LNvs indicate the large ventral lateral neurons, s-LNvs indicate the small ventral lateral neurons, DP indicates the dorsal projection, OL the medulla of the optic lobe, and OT, the posterior optic tract. Arrow in the small right panel indicates loss of termini. The triangle indicates a slight defasciculation of the dorsal projection. (B) Quantification of dorsal projection length for the genotypes shown in A. (C) Confocal reconstructions of the dorsal termini of the s-LNvs in the dorsal protocerebrum of the genotypes shown in A. The left column shows PDF, the middle column anti-GFP, and the right merged micrographs with PDF in magenta and GFP in green. (D) Quantification of the effects of Unc5 expression on brain area (i.e., X-Y spread) innervated by the dorsal termini in a collapsed Z-series from a posterior aspect and (E) The total three-dimensional spread of the dorsal termini. (F) View of the dorsal termini of the genotypes shown in A through the dorsal surface of the brain. Scale bars = 15M. (G) Comparison of 180 degree rotations of the dorsal projections of the genotypes shown in A. Panels represent rotations of the projected Z-series starting from a lateral view and ending with a medial view of the projections. Asterisks indicate significant differences. ** P < 0.01, *** P < 0.001. Error bars represent the standard error of the mean (SEM). See Table S1 for statistical information and sample sizes. See also Figure S1
