
Figure 7. Knockdown of glutamate receptors in the LNvs phenocopies the loss of their dorsal terminal arbors under temperature ramp cycles.
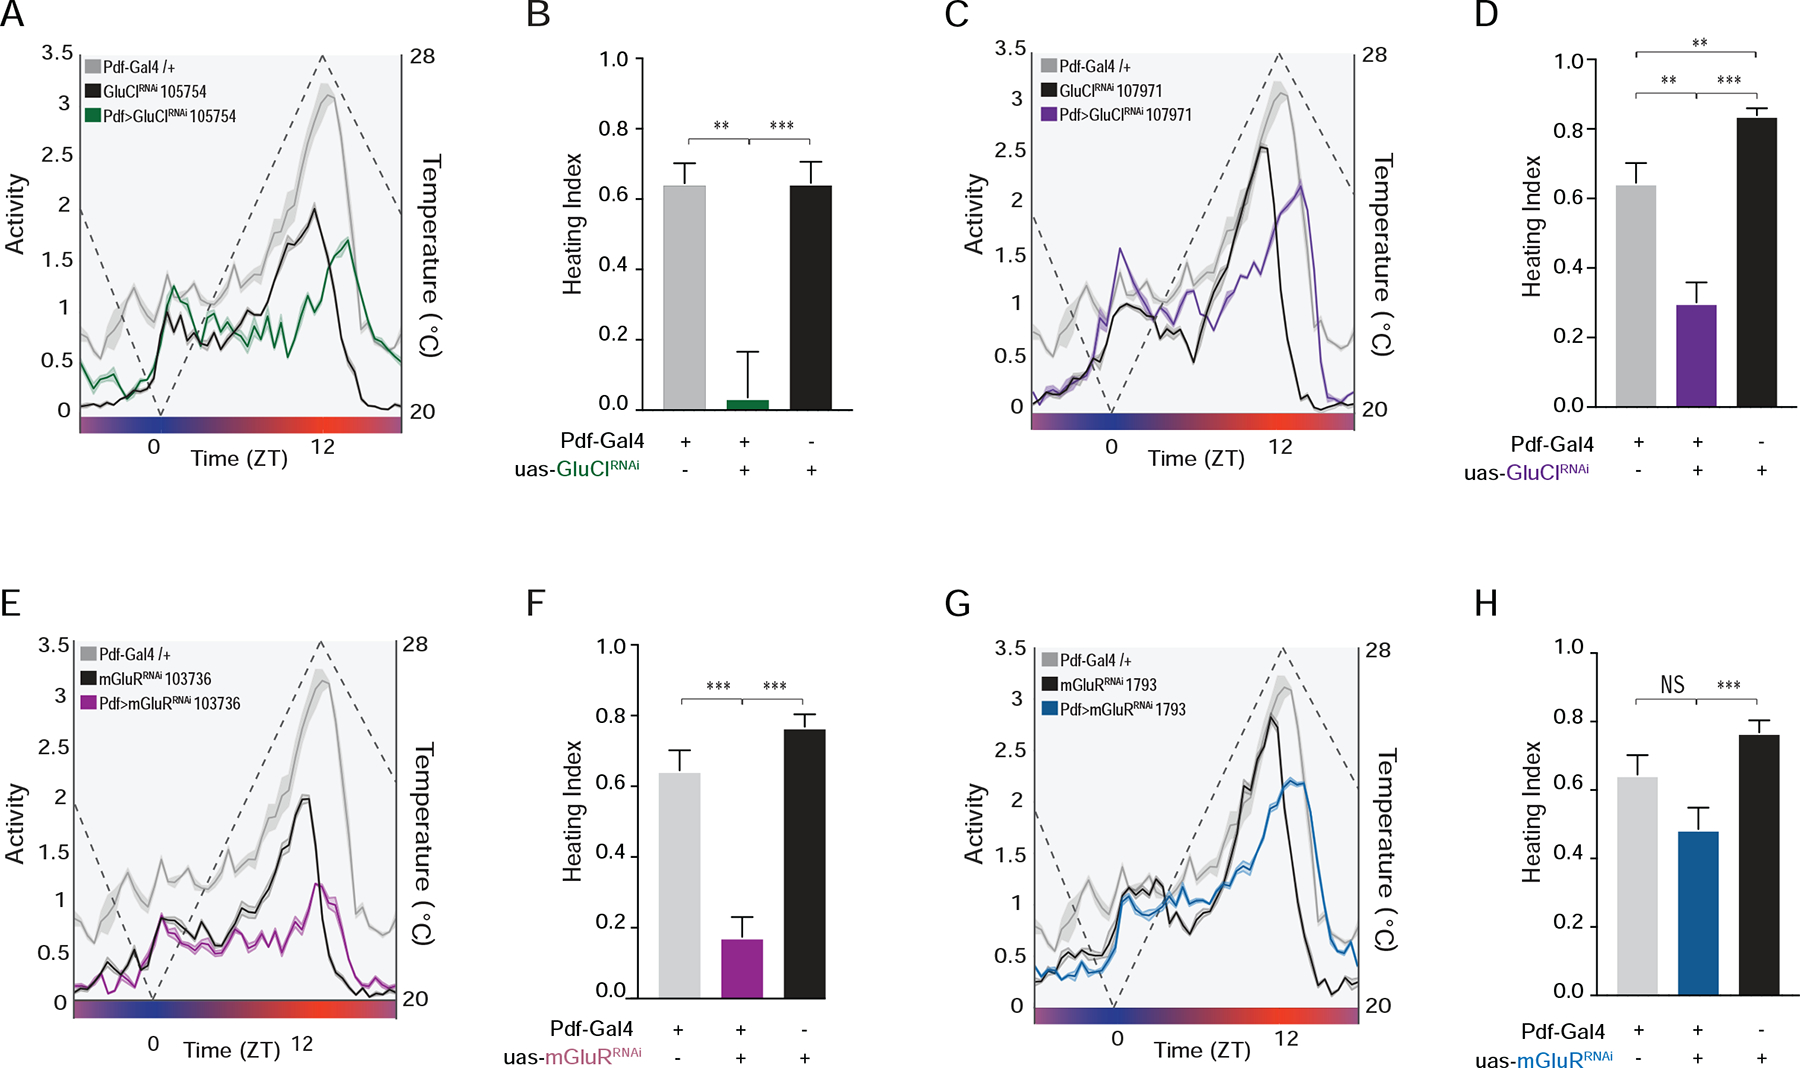
(A) Averaged population activity plots under ramping temperature cycles for experimental ;Pdf-Gal4/UAS-GluCl-RNAi; flies (green) and their parental heterozygous controls ;Pdf-Gal4/+ (gray) and ;UAS-GluCl-RNAi/+; (black). Plots represent the last three days of entrainment to a ramping temperature cycle (days 6–8). The dashed line represents temperature changes. (B) Heating indices for the genotypes shown in A. (C) Averaged population activity plots for ;Pdf-Gal4/UAS-GluCl-RNAi; using a second RNAi construct and their parental controls. (D) Heating indices for the genotypes shown in C. (E) Averaged population activity plots for ;Pdf-Gal4/UAS-mGluRRNAi; and their parental controls. (F) Heating indices for the genotypes shown in E. (G) Averaged population activity plots for ;Pdf-Gal4/+;UAS-mGluR-RNAi/+; using a second RNAi construct and their parental controls. (H) Heating indices for the genotypes shown in G. For all histograms, * P < 0.05, ** P < 0.01, *** P < 0.001, and NS indicates not significantly different. For all activity plots, lines represent mean ± SEM. See Table S1 for statistical information and sample sizes.