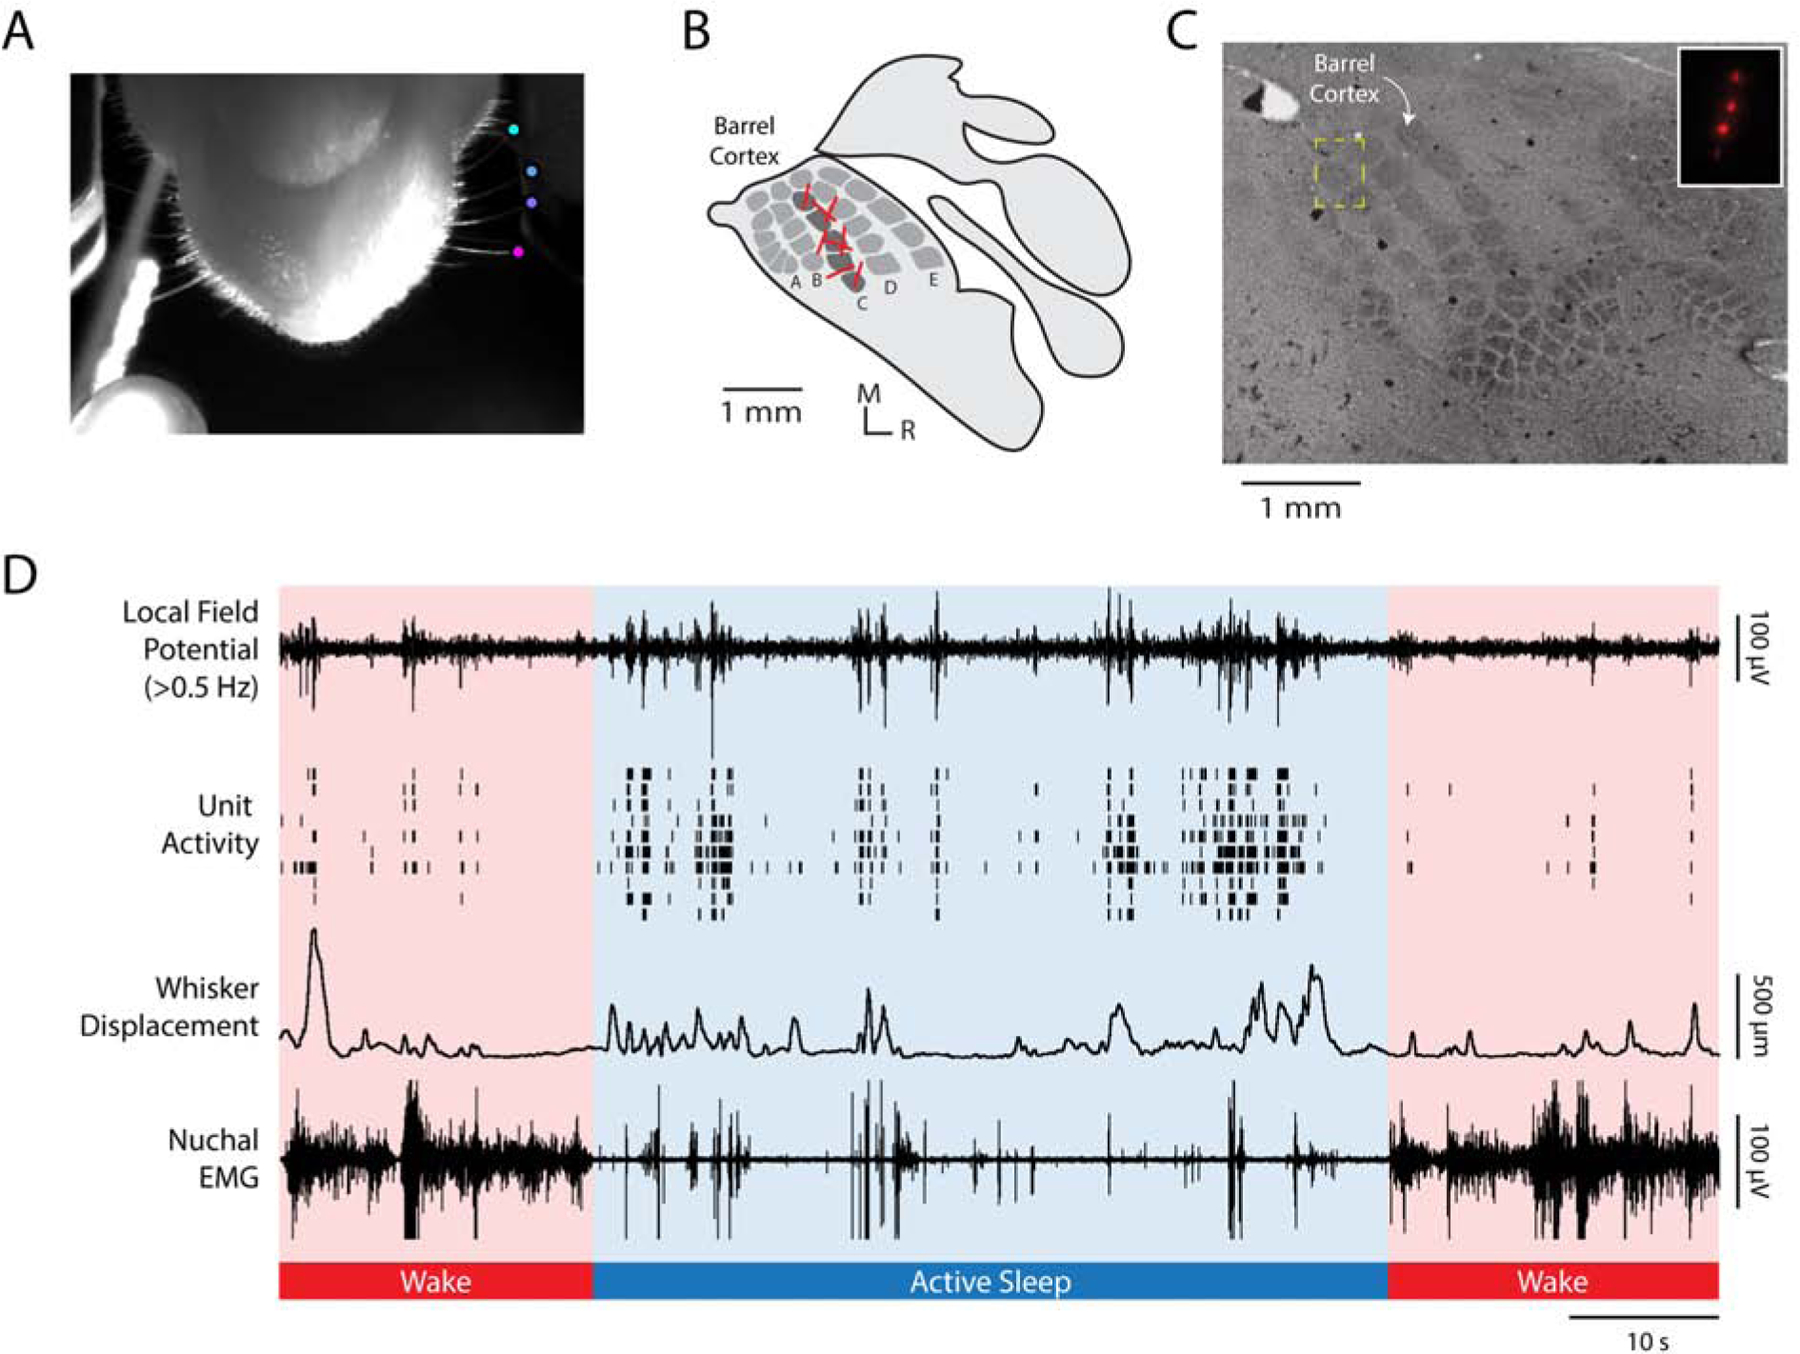
Figure 1. Methods and representative recording.

(A) A video frame, shot from below, illustrating the method for tracking whisker movements using DeepLabCut. Colored dots are located at the tips of four C-row whiskers. Whisker displacement was measured along the animal’s anterior-posterior axis. At the bottom left of the image, the LED used for data synchronization is shown.
(B) Illustration of primary somatosensory cortex (S1) in a P5 rat. Whisker barrels are depicted in dark gray within the S1 map. Electrode shank recording sites for each animal are represented by red lines in the C row of the barrel field.
(C) Representative histological section of barrel cortex. The S1 barrel field was visualized using cytochrome oxidase. The electrode location for a single pup is shown within the yellow dashed box, which is enlarged in the inset to show the fluorescent electrode tracts.
(D) Representative 100-s record for an individual pup during active sleep (blue shading) and wake (red shading). From top to bottom: Local field potential (LFP) recorded in barrel cortex. Unit activity recorded from barrel cortex; each row denotes a different single unit. Whisker displacement, in μm, of all tracked C-row whiskers (i.e., mean displacement). Nuchal EMG recording indicates periods of high muscle tone indicative of wake and periods of low muscle tone, punctuated by brief spikes (i.e., nuchal twitches), indicative of active sleep. Note that LFP and unit activity are highest during active sleep and that whisker movements coincide with increases in barrel cortex activity. See also Figure S1.
