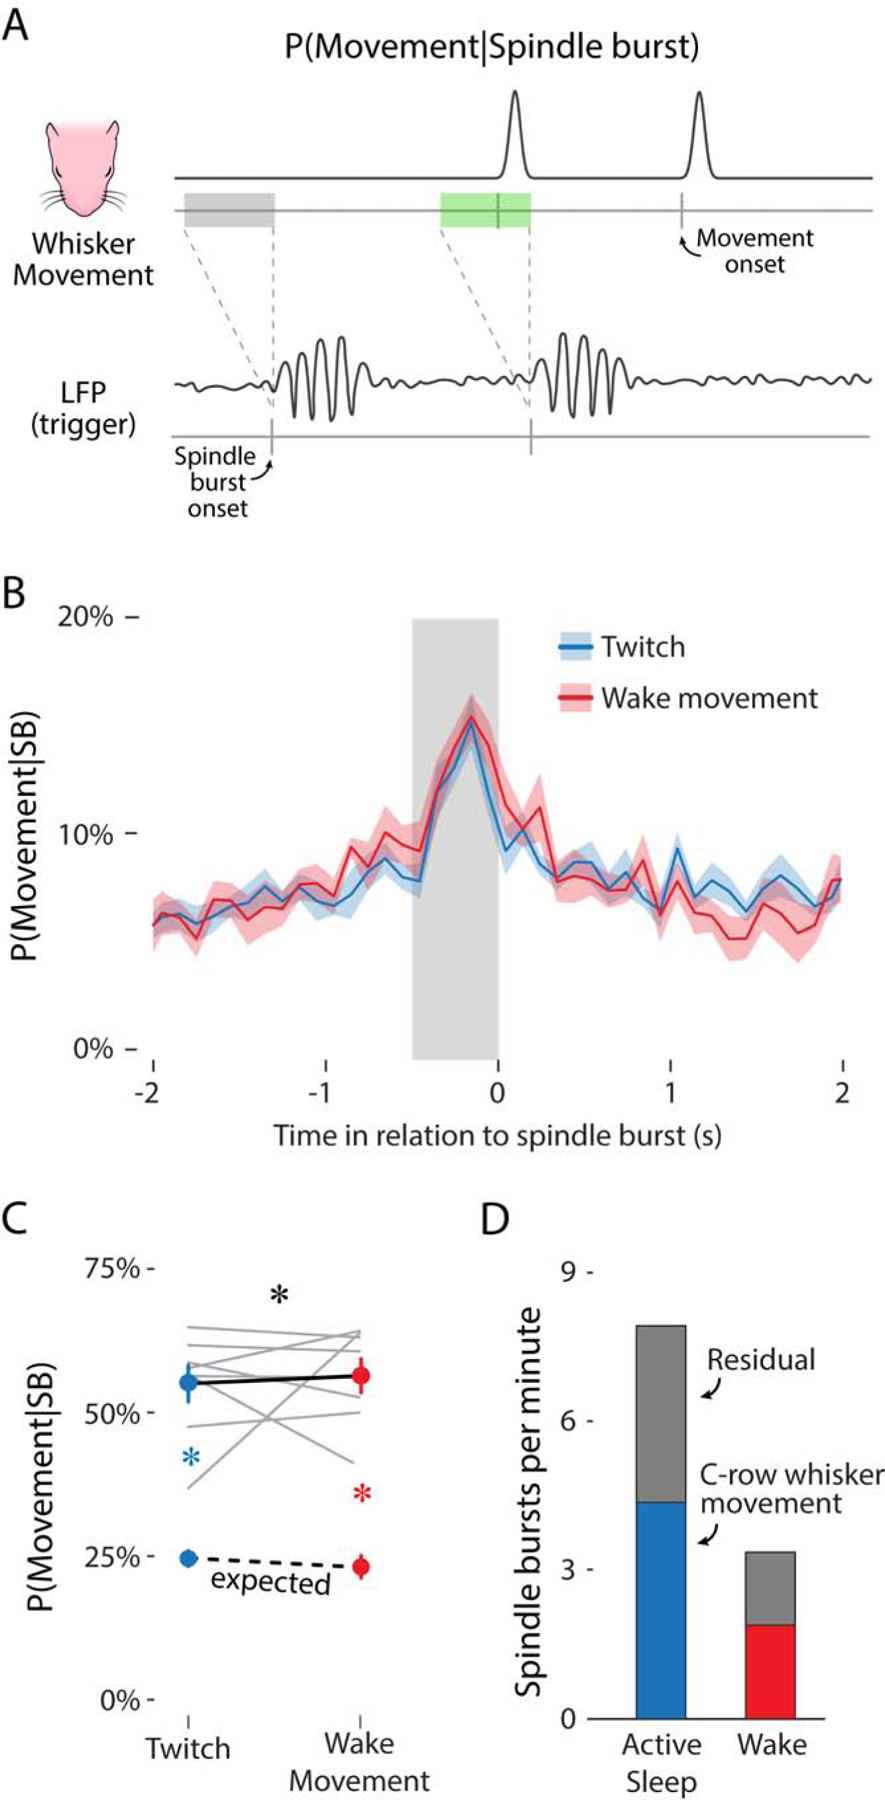
Figure 3. Spindle bursts are reliably preceded by whisker movements.

(A) Illustration of the method used to determine the likelihood of a whisker movement given a spindle burst. Illustration is the reverse of that in Figure 2C, with the triggering event being the onset of a spindle burst (bottom) rather than a whisker movement. For this analysis, two key possibilities are shown: a spindle burst that is preceded within 500 ms by a whisker movement (green rectangle) and a spindle burst that is not preceded within 500 ms by a whisker movement (gray rectangle).
(B) Mean (±SEM) likelihood of a whisker twitch (blue) or wake movement (red) in relation to the onset of a spindle burst. The gray rectangle before spindle burst onset shows a 500-ms window.
(C) Mean (±SEM) likelihood of a whisker twitch (upper blue circle) or wake movement (upper red circle) within the 500-ms window before a spindle burst. The lower colored circles represent the mean (±SEM) likelihood of a twitch (blue) or wake movement (red) due to chance. Gray lines show data for individual pups (N = 8). The expected movement likelihood for individual pups is not shown. Black asterisk indicates a significant interaction (p < .05). Colored asterisks indicate significant observed-expected likelihood differences (p < .05) for whisker twitches (blue) and wake movements (red). See also Figure S4.
(D) Mean rate of spindle bursts per minute during active sleep (blue bar) and wake (red bar) directly attributable to whisker movements (i.e., movement-related activity). Gray bars represent the rate of spindle bursts not attributable to whisker movement (i.e., residual activity).
