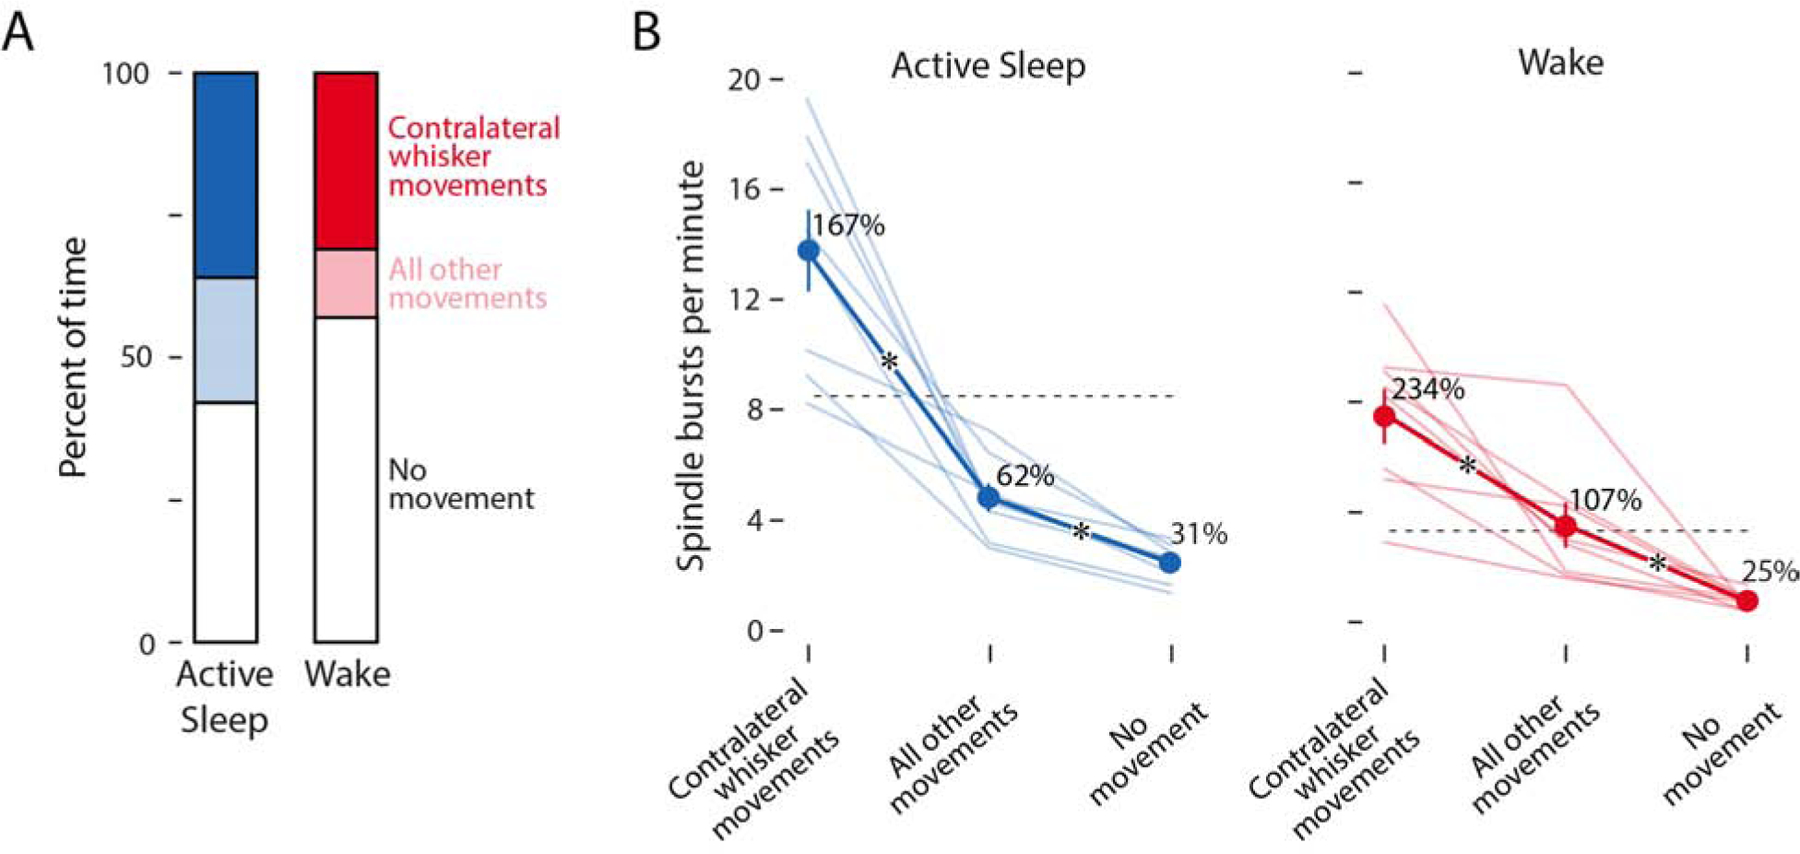
Figure 4. Neural activity increases during periods of movement.

(A) Mean percent of time during active sleep and wake when the contralateral whiskers were moving (dark blue/red), when other parts of the body were moving but the contralateral whiskers were not (light blue/red), and when no discernible movements were detected (white).
(B) Mean (±SEM) rate of spindle bursts per minute during active sleep (left, blue) and wake (right, red). Light blue/red lines show data for individual pups (N = 8). Dashed horizontal lines indicate the mean rate of spindle bursts across the entirety of active sleep and wake periods. Adjacent to each mean value, spindle burst rate is expressed as a percent change in relation to the mean rate within that state. Asterisks indicate significant differences (p < .05) between movement categories.
