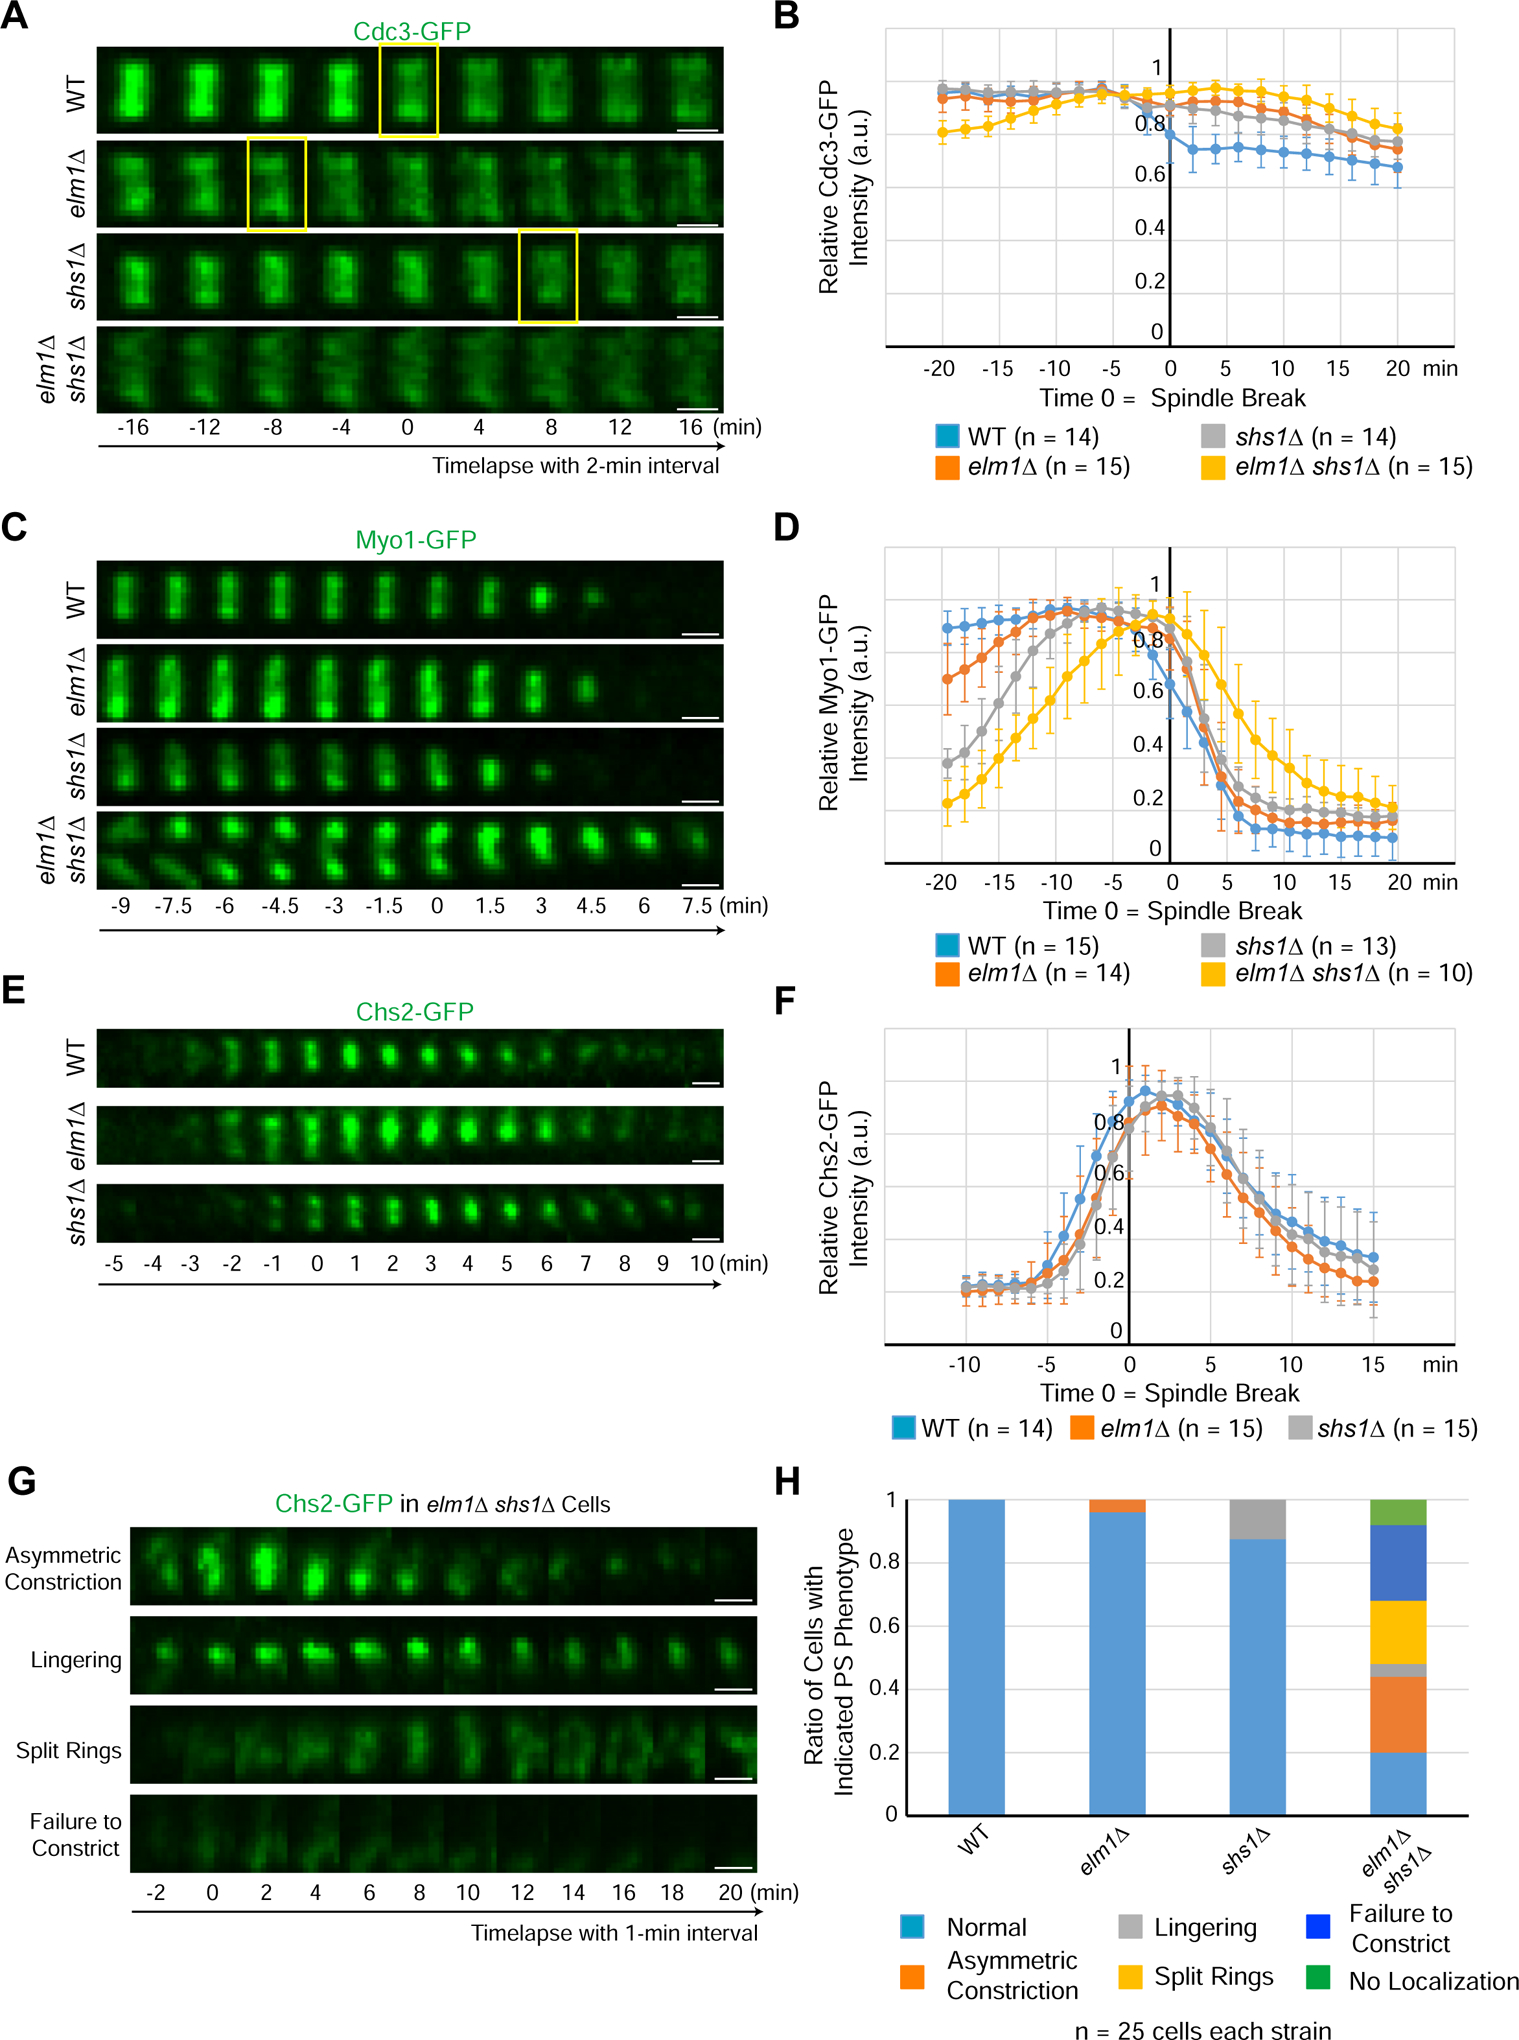
Figure 4. Elm1 and Shs1 promote cytokinesis through their collective control of hourglass assembly and its subsequent remodeling into a double ring.

(A) Montages of representative cells of WT (YEF8118), elm1Δ (YEF8195), shs1Δ (YEF8244), and elm1Δ shs1Δ (YEF8246) showing maximum-intensity projections of Cdc3-GFP 16 min before and after T = 0 (spindle break) with selected frames from time-lapse series taken with a 2-min interval. Scale bars = 1 μm, yellow boxes indicate first time point with a distinguishable septin double ring. See also Figure S4.
(B) Quantification of cells in (4A). Shown is the mean of the background subtracted intensity of Cdc3-GFP normalized to value at maximum value in given number cells for each strain. Error bars are standard deviation, T = 0 is spindle break.
(C) Montages show maximum-intensity projections of Myo1-GFP 9 min before and 7.5 min after T = 0 (spindle break) with a 1.5-min interval between each picture for representative cells of each WT (YEF8367), elm1Δ (YEF8381), shs1Δ (YEF8502) and shs1Δ elm1Δ (YEF8503) strains. Scale bars = 1 μm. See also Figure S4.
(D) Quantification of cells in (4C). Shown is the mean of the background subtracted intensity of Myo1-GFP normalized to value at maximum value in given number cells for each strain. Error bars are standard deviation, T = 0 is spindle break.
(E) Montages show maximum-intensity projections of Chs2-GFP 5 min before and 10 min after T = 0 (spindle break) with 1-min interval between each picture for representative cells of each WT (YEF8219), elm1Δ (YEF8247), shs1Δ (YEF8911) strains. Scale bars = 1 μm.
(F) Quantification of cells in (4E). Shown is mean of the background subtracted intensity of Chs2-GFP normalized to value at maximum value in given number cells for each strain. Error bars are standard deviation, T = 0 is spindle break.
(G) Montages show maximum-intensity projections of Chs2-GFP 2 min before and 20 min after T = 0 (spindle break) with 2-min interval between each picture taken from a time-lapse series with 1-min interval for representative cells of each shown phenotype in shs1Δ elm1Δ (YEF8912) strain. Scale bars = 1 μm.
(H) Quantification of cells with indicated phenotypes in (4E and 4G). n = 25 cells for each strain. “Asymmetric constriction” is constriction from predominantly one side of the bud neck, “lingering” is persistent localization of signal after constriction, “split rings” is a failure to constrict while separating the single band of signal into two ring-like signals, “failure to condense” is an initial localization of cloudy signal to the bud neck but no clear compaction to a band, and “no localization” is a complete failure to localize any signal even after spindle break.
