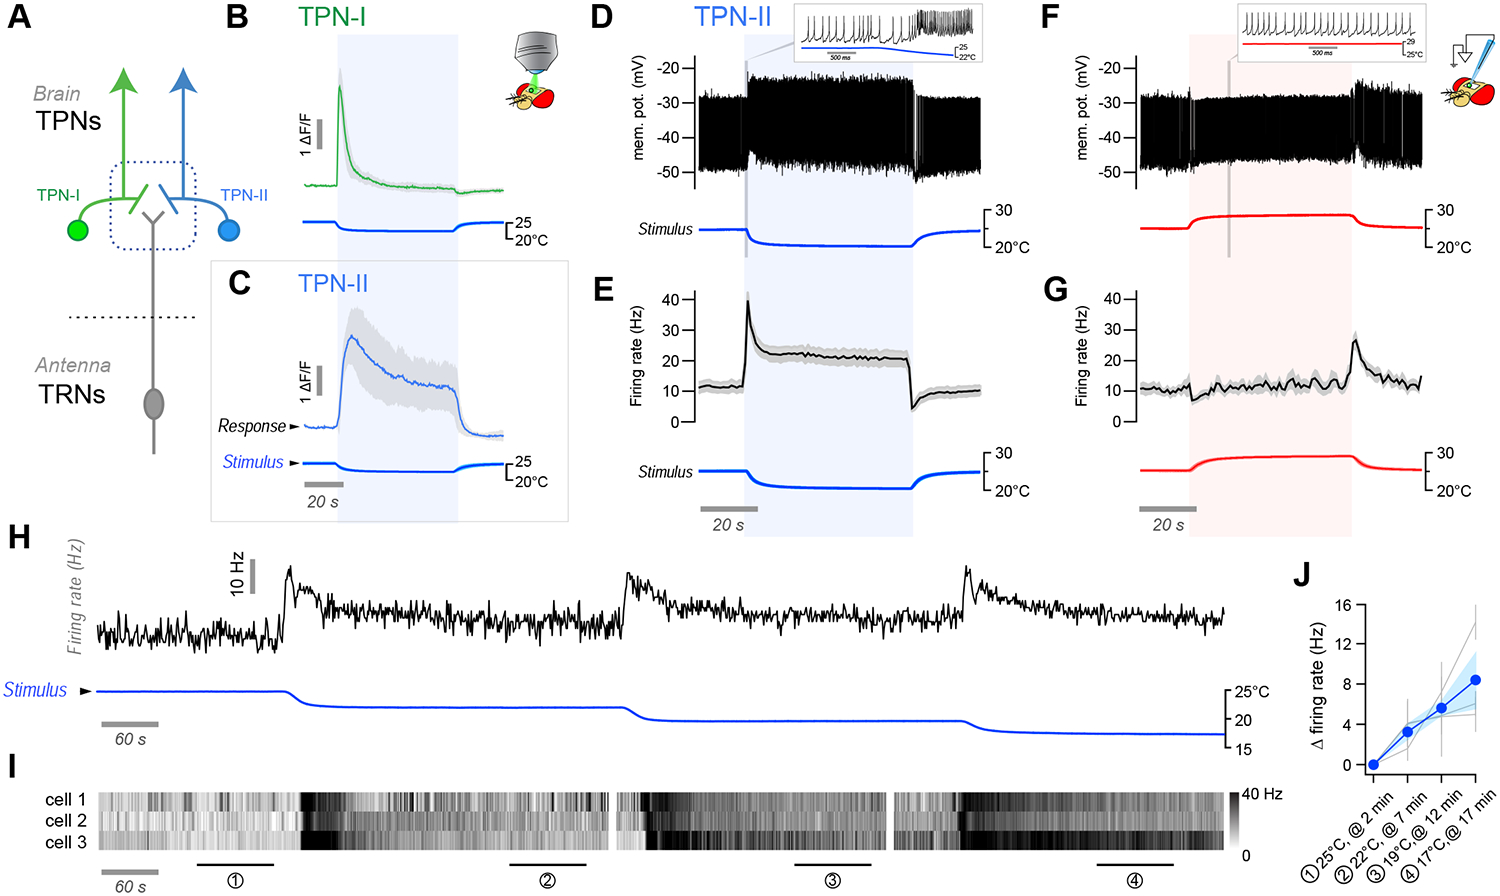
FIGURE 1 |. Identification of thermosensory projection neurons characterized by non-adapting responses.

(A) Thermosensory projection neurons (TPNs) receive synaptic input from antennal thermoreceptors (TRNs). (B,C) 2-photon calcium imaging with GCaMP demonstrates significant differences in the adaptation of (B) type-I fast-adapting and, (C) type-II slow/non-adapting TPNs to a cold temperature step (~1 minute; ΔF/F traces are averages of B: 14 cells/3 animals, C: 5 cells/3 animals, ±SD; stimulus trace is an average of the experiments ± SD). (D-G) 2-photon guided patch clamp electrophysiology reveals that TPN-IIs’ firing is indeed non-adapting. (D) Representative whole-cell current clamp recording from a TPN-II in response to a cold step (~5°C, 1 min.). Inset shows x-axis expansion during cooling. (E) Firing rate histogram for TPN-II’s responses to cold (9 animals/ 9 cells, 3 trials per cell were averaged in each experiment; N=9 cells ±SEM; temp. trace: av. of 9, ±SEM). (F,G) TPN-IIs’ are not significantly modulated by heat. (F) Representative whole-cell current clamp recording from a TPN-II in response to a hot step (~5°C, 1 min.). Inset shows x-axis expansion. (G) Firing rate histogram for TPN-II’s responses to hot (5 cells/4 animals, ±SEM; temp. trace av. of 5, ±SEM). (H-J) TPN-IIs firing does not return to baseline even for extended cooling steps. (H, top) representative recording from a TPN-II subjected to extended cooling steps. (I) Pseudo-colored spike rate histogram of 3 cells in response to a cooling stimulus similar to that in H (~20 minutes recordings, 3 Δt steps as in H, responses aligned to stimuli). (J) Quantification (gray lines = mean ± SD for individual cells calculated in regions corresponding numbered bars in I; blue line/shading = mean ± SEM firing rate across cells, same 3 cells as in I).
