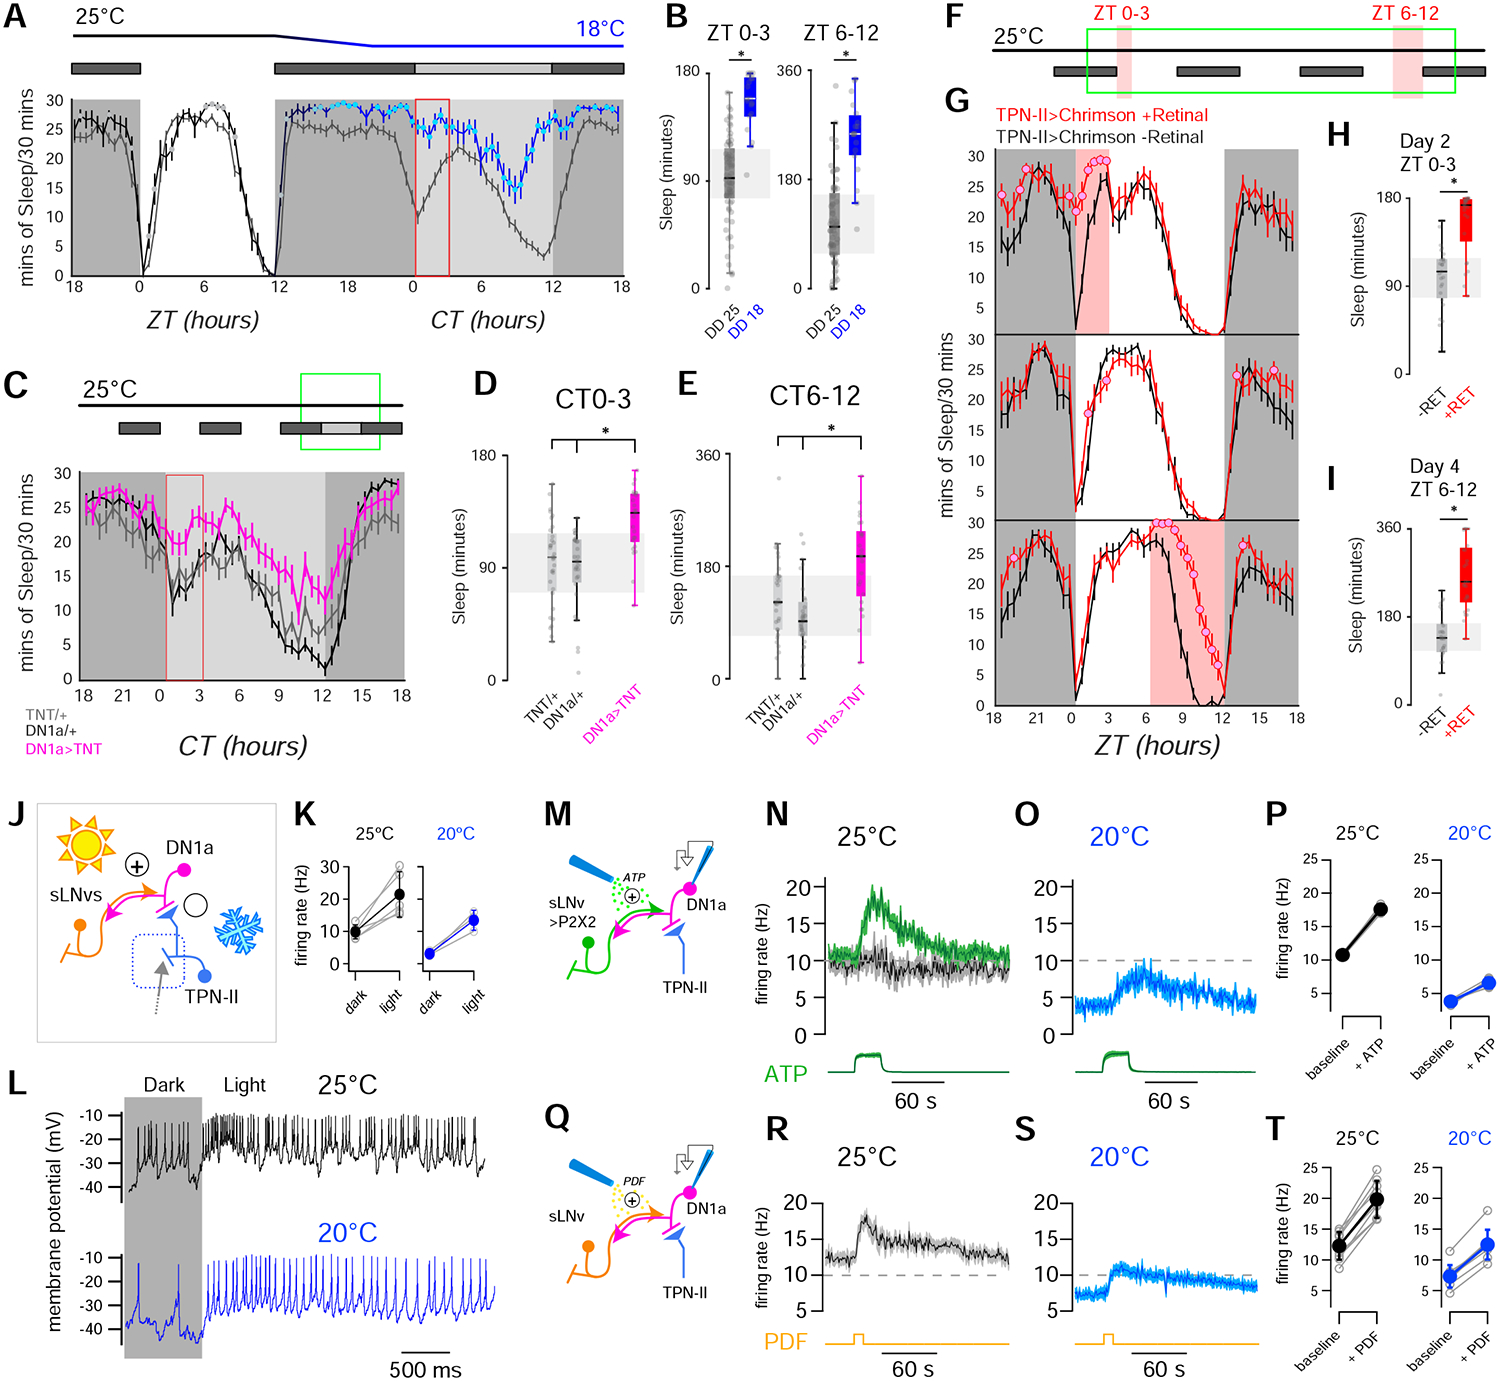
FIGURE 7 |. Sleep and DN1a activity are modulated by the opposing pushes of light and cold temperature.

(A,B) Cold and dark synergize to increase sleep across the day. (A, top) Behavioral protocol used to evaluate sleep on flies entrained in 12hrs Light-Dark (LD) cycles (white box: day (lights on), black box: night (lights off); gray box: subjective day (lights off)). (A, bottom) Sleep plot for two independent groups of control (wild type) flies during a single LD day at 25°C and in the following dark day at either 18°C (blue line N=19 animals, ± SEM) or 25°C (gray line; N=19 animals, ± SEM; filled circles indicate time points that are significantly different between conditions; p<0.05, unpaired 2-sided t-test). (B) Quantification of total sleep in the indicated intervals (box edges: 25th and 75th percentiles; thick lines: median; whiskers: data range; gray dots: individual datapoints/flies; *=p<0.05 in unpaired 2-sided t-test). (C-E) In the dark, suppressing DN1a output by TNT expression mimics cold conditions, increasing sleep across the day. (C, top) Behavioral protocol. (C, bottom) Sleep in DN1a>TNT flies (orange trace; N=25 animals), UAS-TNT/+ (gray; N=32 animals) and DN1a-Gal4/+ flies (black; N=31 animals, all traces are: AV± SEM, circles= significantly different from both controls in 2-way ANOVA, p<0.05). (D,E) Quantification of total sleep in the indicated intervals for genotypes in C (box edges: 25th and 75th percentiles; thick lines: median; whiskers: data range; gray dots: individual data points/flies; *= p<0.05, 2-way ANOVA with a Bonferroni correction for multiple comparisons across genotypes). (F-I) Optogenetic activation of TPN-II produces an acute increase in sleep. (F) Protocol used (3 consecutive days represented top to bottom), red shading indicates optogenetic activation. (G) Sleep pattern of TPN-II>Chrimson flies fed all-trans retinal (red trace; 25 animals) or control food (black; 27 animals -note that retinal is essential for Chrimson function; traces: AV± SEM, circles= significantly different from controls in 2-sided t-tests, p<0.05). (H, I) Quantification of total sleep in the indicated intervals (H) ZT0–3 on day 2, and (I) ZT6–12 on day 4 (box edges: 25th and 75th percentiles; thick lines: median; whiskers: data range; gray dots: individual data points (flies); *=p<0.05, unpaired, 2-sided t-test). (J) Circuit schematic including TPN-IIs (light blue), DN1as (pink) and sLNvs (orange). (K,L) DN1as are excited by light. (K) Light produces robust increases in firing rate at 25°C (black) and at 20°C (blue; gray circles connected by lines represent individual cells; filled circles are av ± SD, * p < 0.05, paired 1-tailed t-test). (L) Representative whole-cell recordings from a single DN1a neuron before and during light stimulation (yellow box), at 25°C (black) or 20°C (blue). (M-P) Artificial activation of sLNvs drives fire rate increases in DN1a and can overcome cold inhibition. (M) Experiment schematic. sLNvs express the exogenous ATP receptor P2X2 and can be activated by pressure ejection of ATP (20mM, green), while patch-clamp records activity in DN1a (pink). (N) ATP (20 mM, green) can drive an increase in DN1a firing at 25°C in animals in which sLNvs express P2X2 (green trace, 4 cells/animals), but not in control animals (driver without the receptor, gray/black trace; 6 cells/ 4 animals). (O) ATP can also overcome cold inhibition of DN1as (4 cells/4 animals av ± SEM; the green trace at the bottom of N and O is Alexa594 fluorescence, a dye included as a marker in the ATP solution, arbitrary fluorescence units ± SEM). (P) Quantification of N and O (gray circles connected by lines represent individual cells; filled circles are av ± SD, * p < 0.05, paired 1-tailed t-test). (Q-T) The neuropeptide PDF can increase DN1a firing to overcome inhibition in the cold. (Q) Experiment schematic. PDF is pressure ejected (50μM, yellow), while patch-clamp records activity in DN1a (pink). (R-T) PDF can drive an increase in DN1a firing both at (R) 25°C or (S) 20°C (9 cells/6 animals av ± SD; the yellow line at the bottom of R and S represent the approximate time of the PDF puff). (T) Quantification of R and S (gray circles connected by lines represent individual cells; filled circles are av ± SD, * p < 0.05, paired 1-tailed t-test; all experiments were done at ZT 0–8).
