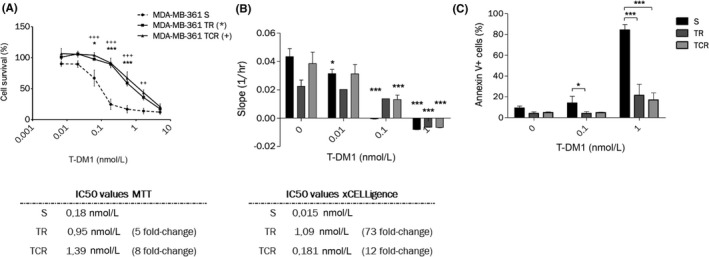
FIGURE 1.

Chronic exposure to T‐DM1 of MDA‐MB‐361 cell line results in decreased sensitivity to the ADC. (A) MTT cytotoxic assays of T‐DM1 on MDA‐MB‐361 S, TR and TCR show an increase in the IC50 values of both resistant cells compared to parental. Statistical analysis was performed by two‐way ANOVA followed by Bonferroni posttests and differences are shown for TR (***: P < .001; **: P < .01; *: P < .05) and TCR (+) compared to S. (B) Parental and resistant cells were exposed to increasing concentrations of T‐DM1 and the cell index was followed by xCELLigence. The slopes of the normalized cell index determined by the RTCA software were plotted. Statistical analysis was performed by Two‐way ANOVA followed by Bonferroni posttests and differences are shown for each cell line between control and exposed conditions (*: P < .05; ***: P < .001). (C) Annexin‐positive cells were studied by flow cytometry after a 6‐day exposure to T‐DM1. The percentage of Annexin‐positive cells decreased in TR and TCR compared to parental cells. Statistical analysis was performed by two‐way ANOVA followed by Bonferroni posttest (*: P < .05; ***: P < .001)
