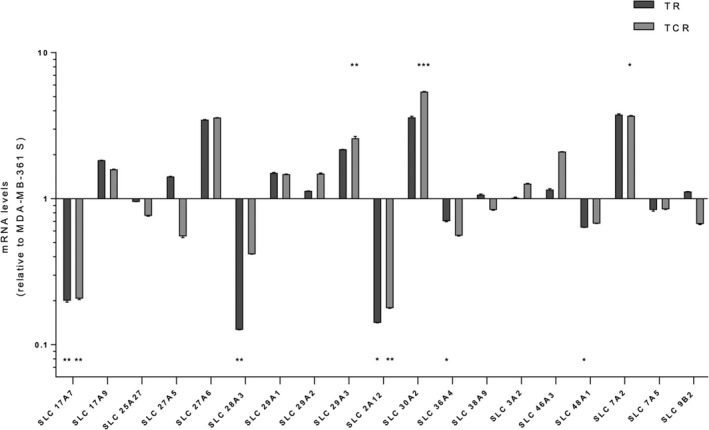
FIGURE 4.

SLC transporter gene expression. The expression levels of selected SLC transporters were assessed by RT‐qPCR. mRNA levels were normalized to the 28S gene and then compared to the parental cell line (MDA‐MB‐361 S) as the fold of each resistant cell line over the parental one. Data are shown as the fold of a single experiment, representative of three independent experiments. Statistics were calculated using the Student's t test (*: P < .05; **: P < .01; ***: P < .001)
