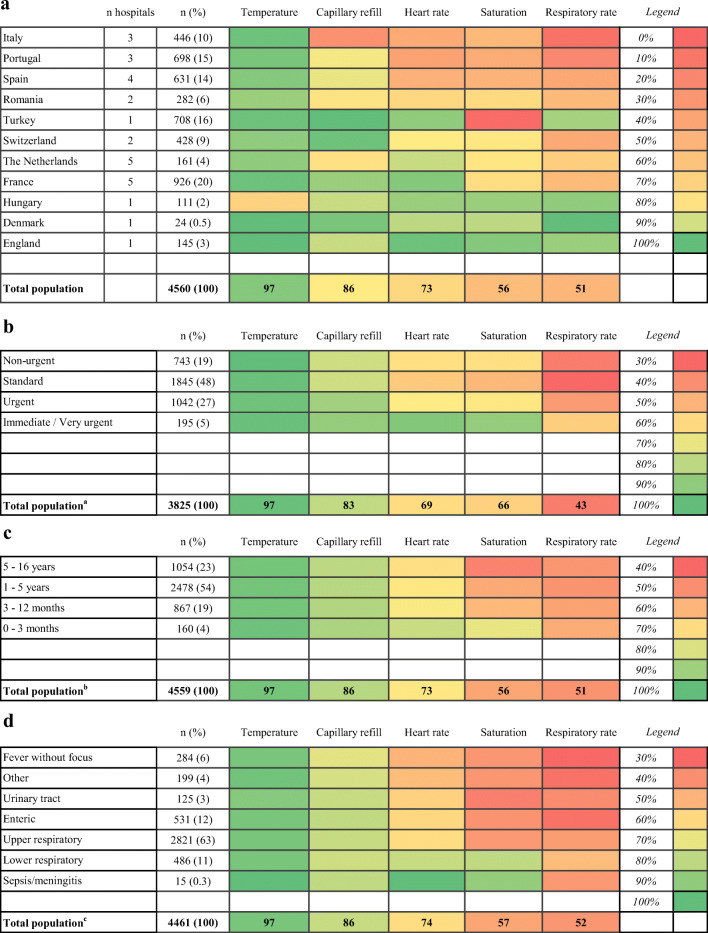
Fig. 2.
Heat maps indicating the frequency of vital sign measurements in % a per country; b per triage level; c per age group; d per diagnosis, Superscript lowercase letters indicate the following: aTurkey (n = 708) and 27 other cases excluded for missing triage level; b1 patient missing age; c99 (2%) missing diagnosis. Categories (country, diagnosis and triage level) are ranked from top to bottom according to how often all of the vital signs were measured. Vital signs are in turn organized from left to right based on their frequency of measurement overall. Green indicates highest frequency of measurement per figure; red indicates lowest frequency of measurement

