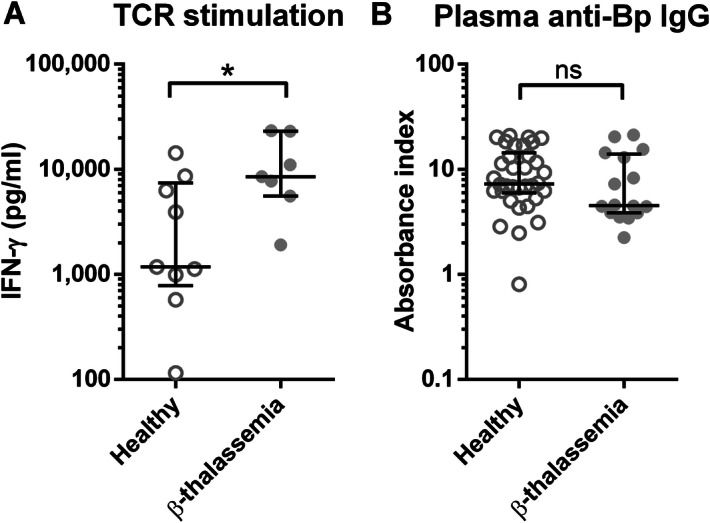
Figure 2.

Comparison of plasma anti-Bp IgG antibody level and IFN-γ production upon TCR stimulation between samples from healthy donors and β-thalassaemia patients. Whole blood from healthy control (open circle, n = 9) and β-thalassaemia patients (filled circle, n = 7) were stimulated with anti-CD3 and anti-CD28 antibodies for 48 h before measured for IFN-γ in supernatant by ELISA (A). Plasma anti-Bp IgG from healthy controls (open circle, n = 34) and β-thalassaemia patients (filled circle, n = 16) were measured by ELISA (B). The results were shown as scattered dot plot and line at median with interquartile range. Statistical analysis was done by using Mann Whitney test; *P < 0.05, ns non-significant.
