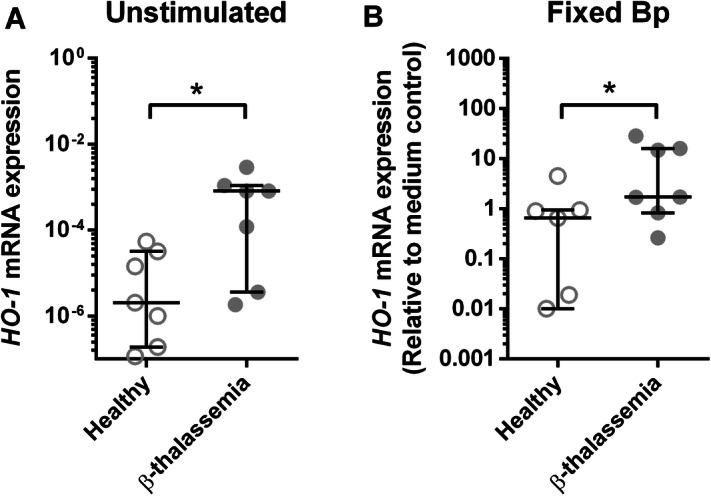
Figure 3.

Increasing of whole blood HO-1 expression from β-thalassaemia patients compared to healthy donors with and without fixed Bp stimulation. HO-1 expression from whole blood of healthy controls (open circle, n = 7) and β-thalassaemia patients (filled circle, n = 7) were analyzed by real-time PCR using GADPH as internal reference gene. Unstimulated whole blood of healthy and β-thalassaemia were analyzed for ΔCt between HO-1 and GADPH before calculated for HO-1 mRNA expression by 2−ΔCt. PFA fixed Bp stimulated whole blood of healthy and β-thalassaemia were analyzed for ΔCt between HO-1 and GADPH, then ΔΔCt comparing to medium control before calculated for HO-1 mRNA expression by 2−ΔΔCt. Results were plotted as scattered dot plot and line at median with interquartile range. Statistical analysis was done by using Wilcoxon matched pairs signed rank test or Mann Whitney test; *P < 0.05 and **P < 0.01.
