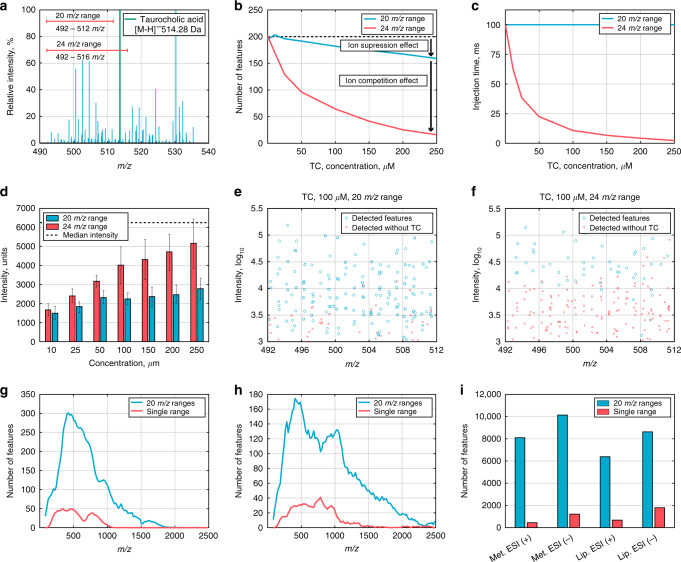
Fig. 1. Ion competition in the detection system explains the reduced sensitivity of FI-MS.
a An experimental scheme for investigating ion suppression and ion competition effects in FI-MS analysis: gradually increasing the ion flow by adding increasing concentrations of some compound to the analyte, while configuring the mass spectrometer to scan for two overlapping ranges that include or exclude the added compound; here, taurocholic acid (TC) was added to metabolite extracts from serum samples, while a 20 m/z scan range, which excludes this compound and an overlapping 24 m/z scan range that includes it are scanned. b The number of reproducible m/z features found (within the narrower scan range) when scanning for the 20 m/z scan range (in blue) and for the 24 m/z scan range (in red), adding increasing concentrations of TC; black horizontal line represents the number of m/z features detected without adding TC. c Observed injection time of curved linear trap as a function of the concentration of the added TC. d The median intensity of m/z features (n ≥ 15; ±SEM; measured without adding TC; y axis) which become undetected when adding increasing concentrations of TC (x axis), scanning for the 20 m/z scan range (in blue) and for the 24 m/z scan range (in red); black horizontal line represents the median intensity of m/z features detected without adding TC. Ion intensity (y axis) and m/z (x axis) detected in serum when scanning for the 20 m/z scan range (e) and the 24 m/z scan range (f); ions undetected when adding 100 μM of TC are marked with red crosses. Distributions of the number of reproducible m/z features found by spectral-stitching FI-MS method (20 m/z scan ranges; in blue) versus scanning using a single range (in red) for metabolomics (g) and lipidomics (h) analysis (negative ionization mode). i The total number of reproducible m/z features found by spectral-stitching FI-MS (in blue) versus scanning using a single scan range (in red), for metabolomics and lipidomics, in positive and negative ionization modes. Source data are provided as a Source data file.

