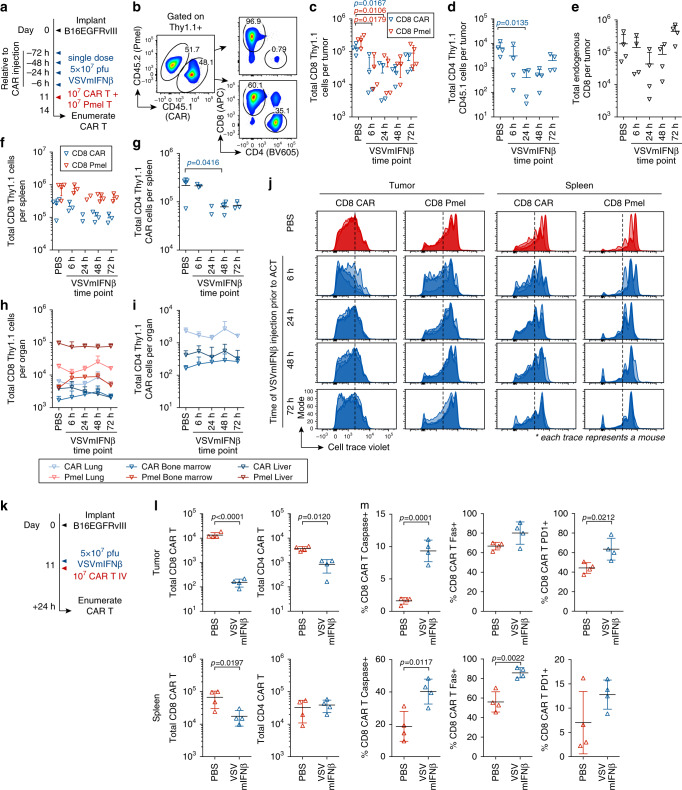
Fig. 2. Oncolytic VSVmIFNβ infection promotes T cell attrition in the tumor and spleen.
a Mice bearing B16EGFRvIII tumors received a single intratumoral injection of 5 × 10⁷ pfu of VSVmIFNβ or PBS at various time points (6 to 72 h) prior to adoptive transfer of 1 × 10⁷ activated Pmel T cells + 1 × 10⁷ EGFRvIII CAR T cells on day 11. b Both the CAR retrovirus and the Pmel mice express the congenic marker Thy1.1. To distinguish CAR T cells from C57 WT mice and Pmel T cells, CAR T cells were prepared from CD45.1 donor mice. Three days post-adoptive transfer, the number of viable Thy1.1+ CD8 (C) and CD4 (d) and endogenous CD8 (e) T cells were quantified in the tumor and represented as mean ± SD for n = 4/group. The number of viable Thy1.1 CD8 (f) and CD4 (g) T cells were quantified in the spleen and represented as mean ± SD for n = 4/group except in the VSV 6 h and 72 h time points n = 3 and VSV 24 h time point n = 2. The number of viable Thy1.1 CD8 (h) and CD4 (i) T cells were quantified in the lungs, liver, and left tibia and femur (bone marrow) and represented as mean ± SD for n = 4/group. j Pmel and CAR T cells were labeled with Cell trace violet and proliferation is shown in the tumor, and spleen. The Cell trace violet dilution for all four mice per group is overlaid. Data (c-j) are representative of two independent experiments. k B16EGFRvIII tumor bearing mice received PBS or 5 × 10⁷ pfu of VSVmIFNβ intratumorally 6 h prior to adoptive transfer, and 24 h later, tumors and spleens were harvested. Total live CD8 and CD4 CAR T cells in the tumor (upper panels) and spleen (lower panels) is shown as mean ± SD for n = 4/group in (l). The percentage of live CD8 CAR T cells expressing cleaved caspase, Fas and PD1 in the tumor (upper panels) and spleen (lower panels) is shown as mean ± SD for n = 4/group in (m). The experiment in k–m was performed once. Symbols from (h) and (i) represent mean group data; symbol from all other panels represent individual mice. P-values were determined using a two-way ANOVA with a Tukey multiple comparisons post-test (c), a one-way ANOVA with a Tukey multiple comparisons post-test (d, g) or an unpaired two tailed t-test (l) on log-transformed data. P-values were determined using an unpaired two tailed t-test (m). Statistical significance set at p < 0.05, ns > 0.05. Source data are provided in the Source Data File.

