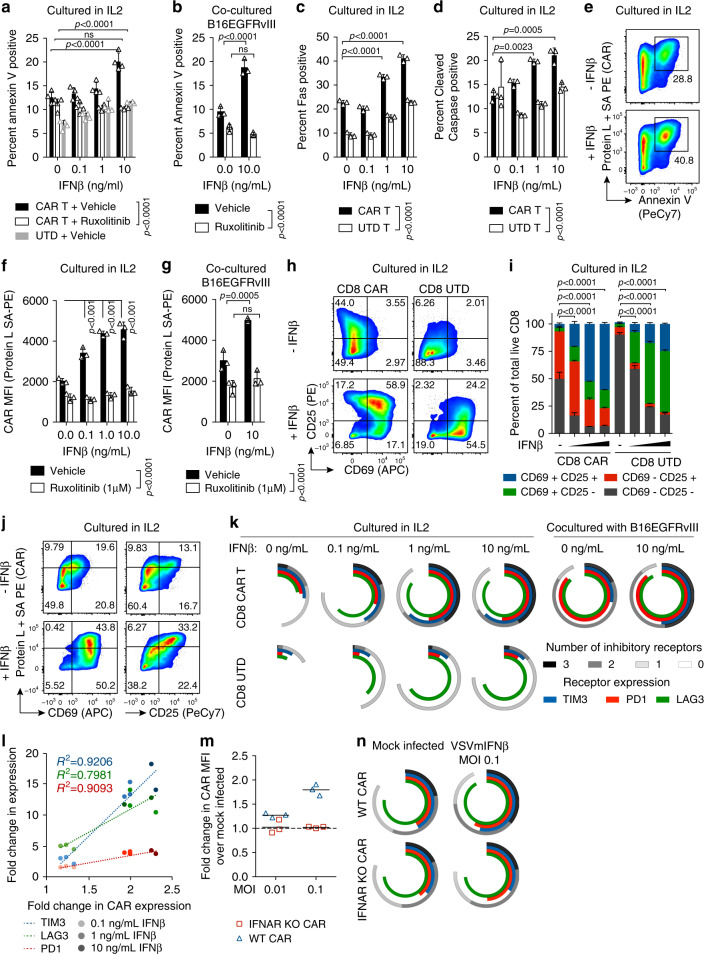
Fig. 4. Recombinant IFNβ promotes apoptosis, activation, inhibitory receptor expression, and dysregulated expression of the CAR.
a Annexin V expression on CD8 CAR T cells or untransduced (UTD) T cells cultured in IL2 (50 U/mL) in the presence or absence of recombinant murine IFNβ and 1μM Ruxolitinib (JAK1/2 inhibitor) for 48 h. b Annexin V expression on CD8 CAR T cells cocultured with B16EGFRvIII cells at an E:T ratio of 1:5 in the presence or absence of recombinant murine IFNβ and/or 1μM Ruxolitinib. Fas (c) or cleaved caspase (d) expression on CD8 CAR T cells or UTD cells cultured in IL2 with IFNβ. e Median fluorescence intensity (MFI) of CAR expression measured using Biotin-Protein L and streptavidin- PE (Protein L + SA PE) compared to Annexin V on CAR T cells cultured in IL2 with or without IFNβ (10 ng/mL). CAR expression on CD8 CAR T cells cultured in IFNβ for 48 h in the absence (f) or presence of target tumor cells (g). Representative (h) and mean (i) expression of CD25 and CD69 for CAR T cells cultured in IL2 with IFNβ. Statistical comparisons are indicated for CD25- CD69- populations in (i). j Co-expression of the CAR and activation markers on CD8 CAR T cells. k Mean expression of PD1, LAG3, TIM3 on CD8 CAR T or UTD cells cultured in IL2 or in the presence of B16EGFRvIII cells (E:T 1:5). l Fold change in inhibitory receptor and CAR expression is shown for cells grown in IL2 with additional recombinant IFNβ relative to culture in IL2 alone. m WT or transgenic IFNAR1 KO CAR T cells were cocultured with B16EGFRvIII (E:T ratio of 1:5) which were mock infected or infected with VSVmIFNβ 6 h prior to coculture. Surface CAR expression is represented as fold change relative to coculture with mock infected tumor cells. n Inhibitory receptor expression was quantified on WT or IFNAR1 KO CD8 CAR T cultured as in (m). Data are representative of two independent experiments (panels a–l). Experiments in panels (m, n) were performed once. Means ± SD of n = 4 (panel a) or n = 3 (panels b–d, f, g, i, k, m, n) technical replicates are shown. P-values were determined using a two-way ANOVA with a Tukey multiple comparisons post-test (a–d, f, g, i). Statistical significance set at p < 0.05, ns > 0.05. Source data are provided in the Source Data File.

