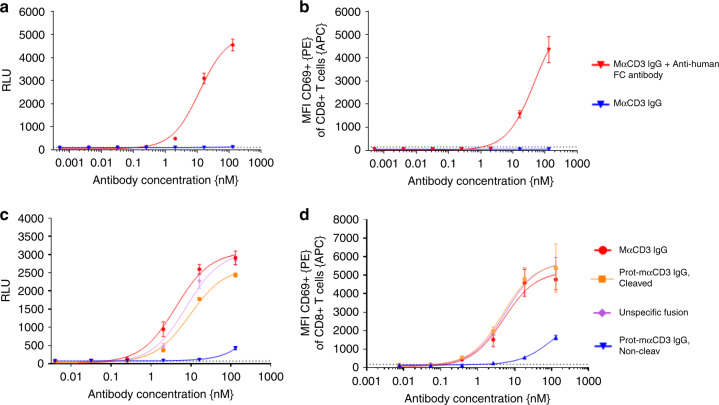
Fig. 4. T-cell activation is reversibly impaired by blocking anti-CD3 binder.
T-cell/Jurkat NFAT activation is dependent on crosslinking of mα-CD3. a Monovalent anti-CD3 IgG is able to activate luciferase in a Jurkat NFAT luciferase reporter cell line after crosslinking by plate-coated anti-human Fc (red curve) whereas in the absence of crosslinking no luciferase activity can be detected (blue curve). The dotted line indicates the luminescence for Jurkat NFAT-cells without mα-CD3 IgG on plate-coated anti-human Fc. Each value represents the mean of triplicates, standard deviation is indicated by error bars (representative experiment of n = 3). b Monovalent α-CD3 IgG is able to activate CD8-positive T cells, measured by quantification of the early activation marker CD69, after crosslinking by plate-coated anti-human Fc (red curve) whereas in the absence of crosslinking no CD8-positive T-cell activation can be detected (blue curve). The median fluorescence intensity (MFI) for CD69 of CD8 T cells is shown. Each value represents the mean of triplicates, standard deviation is indicated by error bars (representative experiment of n = 3). c, d mαCD3 IgGs were bound to plate-coated anti-human Fc antibody before Jurkat NFAT reporter cells or PBMCs were added. Jurkat NFAT activation is measured in relative luminescence units (RLU) and T-cell activation was assessed by quantification of CD69 by FACS analysis. Cleavage of the Prot-mαCD3 IgG containing a matriptase cleavable linker was performed by incubation of Prot-mαCD3 IgG with purified recombinant human matriptase for 24 h at 37 °C. c Jurkat NFAT activation mediated by Prot-mαCD3 IgG. Cleaved Prot-mαCD3 IgG, blocked Prot-mαCD3 IgG, mαCD3 IgG and mαCD3 IgG with an N-terminal fusion of a nonspecific fusion (anti-CEA Fab) are shown. The dotted line indicates the luminescence for Jurkat NFAT-cells without any CD3 IgG. Each value represents the mean value of triplicates, standard deviation is indicated by error bars (representative experiment of n = 3). d The median fluorescence intensity (MFI) for CD69 of CD8 T cells is shown. Each value represents the mean value of triplicates, standard deviation is indicated by error bars (representative experiment for three different human PBMC donors).

