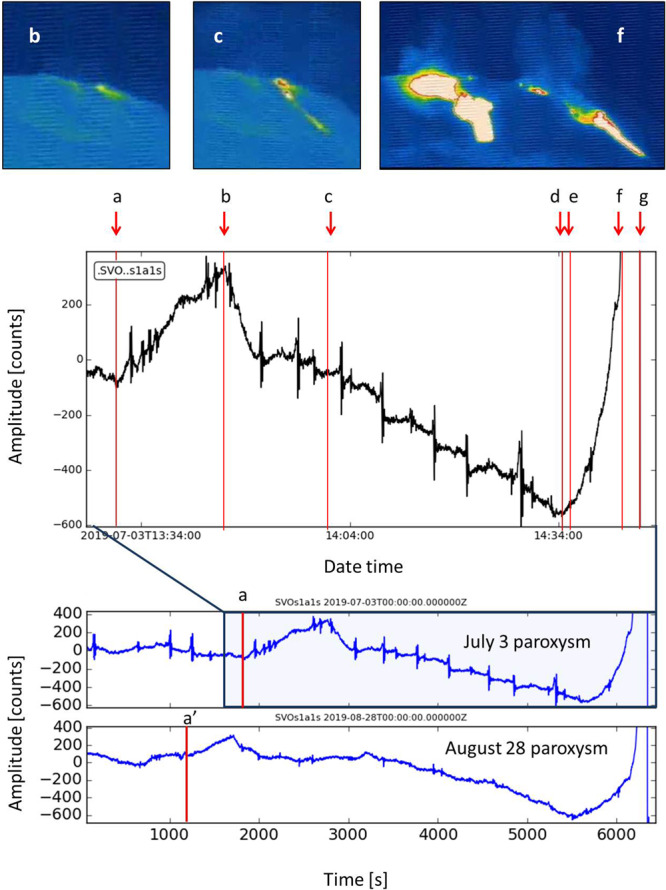
Figure 11.

Signals of the SVO strainmeter recorded before the July 3 and August 28, 2019 paroxysms. The magnified signal relating to the July 3 (top of the plot) is compared with the precursory effusive phase recorded by the cameras. (a) is the beginning of a strain increase (13:30:00 UTC); (b) marks the first minor lava overflows (13:46:00); (c) indicates a small vent opening at the base of NE crater, feeding a thin lava flow (14:00:30); (d) minimum strain (14:34:32); (e) automatic trigger (14:35:44); (f) small intra-crater lava flow (14:43:10); (g) paroxysmal explosion beginning (14:45:40). The INGV camera images at the top of the figure indicate the moments relative to the corresponding letters. b and c are camera images from the SQT camera (view from NE of the NE crater flank) and f camera image is from the SPT camera (view from South of the whole crater terrace). SQT and SPT are Q and P in Fig. 1, respectively. The software used to create the figure is Python 2.7 (https://www.python.org/).
