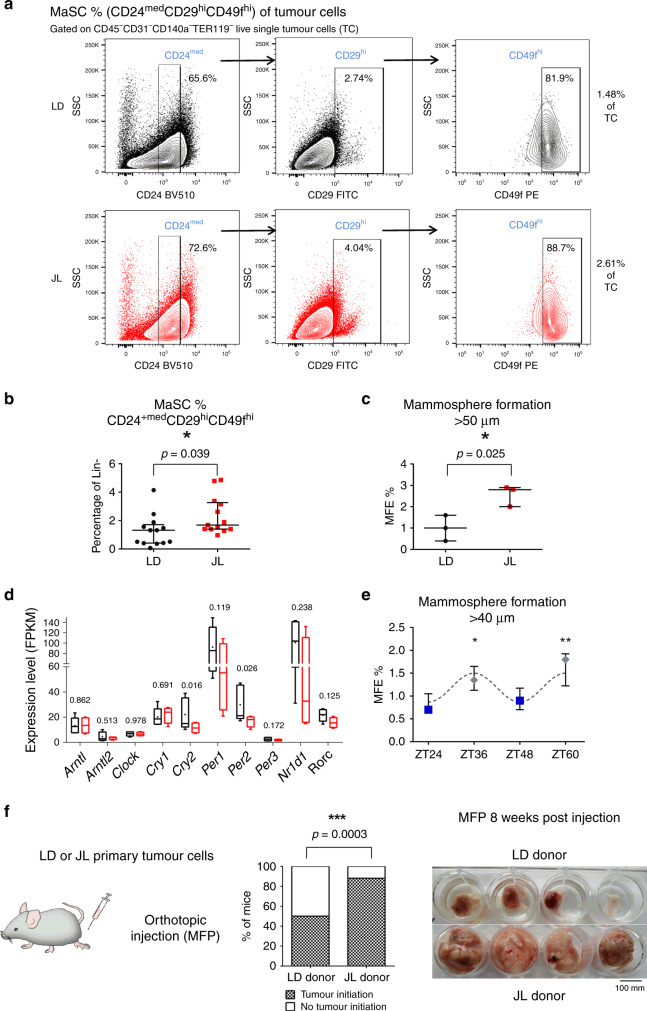
Fig. 4. Chronic circadian disruption increases cancer-cell stemness in primary tumours.
a Representative gating strategies for CD24medCD29hiCD49fhi mammmary stem cells (MaSC) with contour plots shown for LD (black) and JL (red) tumours (SSC: side scatter). b Frequency of CD24medCD29hiCD49fhi mammary stem cells (MaSC) in LD and JL tumours (n = 13). Data are shown as a scatter dot plot with lines indicating the median with interquartile range (error bars). P-value obtained from an unpaired two-sided t-test. c Mammosphere-formation efficiency (MFE%) of LD and JL tumour cells (n = 3). Data are shown as a scatter dot plot with lines indicating the median with interquartile range (error bars). P-value obtained from an unpaired two-sided t-test. d Circadian clock genes mRNA expressions (FPKM: Fragments Per Kilobase Million) in cancer cells from LD (n = 5) and JL (n = 4) primary tumours. Data presented as box-and-whisker plots. Variability is shown using medians (line in the box), 25th and 75th percentiles (box), and min to max (whiskers). P-values were calculated using DESeq2 and the Wald test based on the negative binomial distribution. Respective log2FoldChange (log2FC) are listed in Supplementary Data 3. e Mammosphere-formation efficiency (MFE%) of MCF12A normal human mammary cells in different circadian phases (n = 3). Blue squares and grey diamonds represent peaks of BMAL1HIGH/PER2LOW and BMAL1LOW/PER2HIGH expression, respectively. Data are presented as a dot plot with dots indicating the median with interquartile range (error bars). P-value was calculated from a one-way ANOVA/Tukey’s multiple comparisons test. f Tumour-initiation study based on orthotopic injection of primary tumour cells from LD (n = 6) and JL (n = 6) mice in the mammary fat pad (MFP) of host mice (n = 4 per each donor). Tumour-initiation potential was calculated as the percentage of host mice that formed tumours. We set a threshold based on MFP weight at 0.25 g for positivity. P-value was obtained from a binomial two-sided test. The picture illustrates the observed differences between MFP between JL and LD donors. Indicated (n) represent number of independent experiments as biological replicates.

