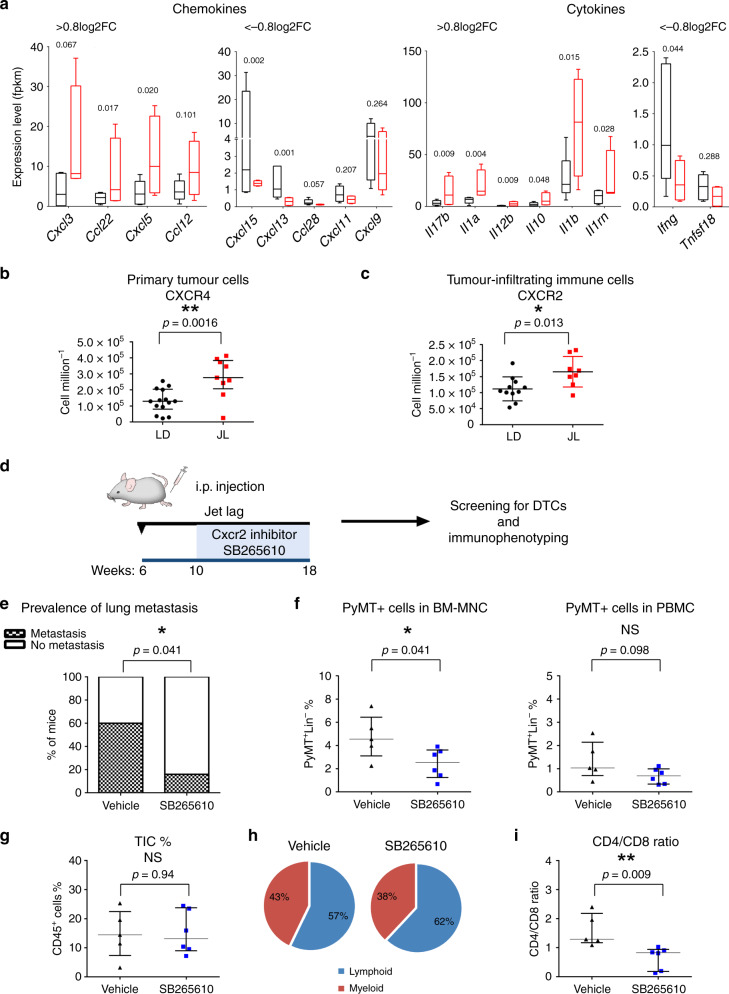
Fig. 6. Circadian disruption alters chemokine/cytokine regulatory networks.
a The most up- and downregulated chemokines and cytokines in LD (n = 5) and JL (n = 4) tumours, as detected by mRNA-seq. Expression data represent FPKM values and are presented as box-and-whisker plots. Variability is depicted using medians (line in the box), 25th and 75th percentiles (box), and min to max (whiskers). P-values were calculated using DESeq2 and the Wald test based on the negative binomial distribution. Respective log2FoldChange (log2FC) are listed in Supplementary Data 3. b Number of tumour cells positive for CXCR4 in LD (n = 14) and JL (n = 9) tumours. Data are shown as a scatter dot plot with lines indicating the median with interquartile range (error bars). P-values obtained from unpaired two-sided t-test. c Number of tumour-infiltrating immune cells positive for CXCR2 in LD (n = 11) and JL (n = 8) samples. Data are shown as a scatter dot plot with lines indicating the median with interquartile range (error bars). P-values obtained from unpaired two-sided t-test. d–i Effects of CXCR2 inhibition on tumour development in JL mice. d Scheme illustrating the experimental plan. MMTV:PyMT mice were subjected to chronic jet lag from the age of 6 weeks, and from 10 to 18 weeks of age were intraperitoneally (i.p.) injected once a day (5 days injection + 2 days resting) with the CXCR2 antagonist SB265610 (2 mg kg−1 in 5% DMSO–8% Tween80 0.9% NaCl). Mice were sacrificed at 18 weeks of age. e Prevalence of lung metastasis in mice injected with vehicle (n = 5) or SB265610 (n = 6). P-value obtained from a binomial two-sided test. f The percentage of disseminated tumour cells in BM and peripheral blood in mice injected with vehicle (n = 5) and SB265610 (n = 6). g Percentage of tumour-infiltrating immune cells (TIC) in mice injected with vehicle (n = 5) and SB265610 (n = 6). h Relative distribution of lymphoid and myeloid TICs in both cohorts. Data are presented as pie charts displaying the mean values of mice. i CD4/CD8 ratio in tumours from vehicle (n = 5) and SB265640 (n = 6) groups. Data (f, g, i) are presented as scatter dot plots with lines indicating the median with interquartile range (error bars). P-values were calculated from an unpaired two-sided t-test. Indicated (n) represent number of independent experiments as biological replicates.

