Figure 2.
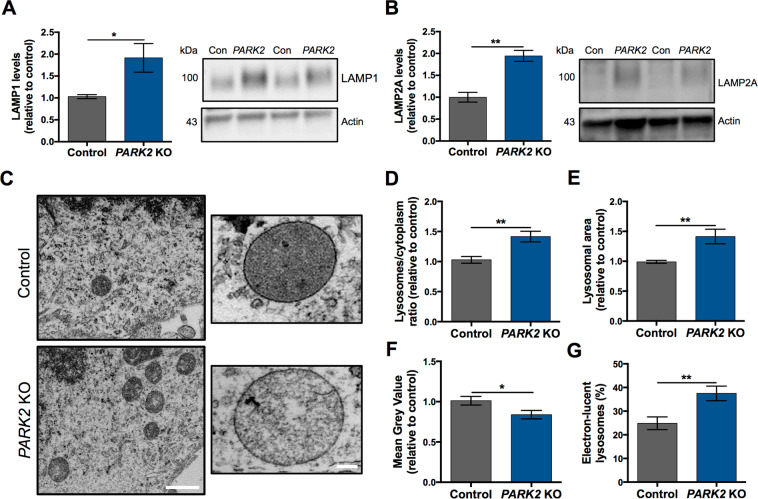
PARK2 KO neurons exhibit aberrant lysosomes. (A,B) Western blotting analysis of the abundance of lysosomal markers, (A) LAMP1 and (B) LAMP2A. Expression levels were normalized to β-actin and are shown relative to control neurons. Full-length blots are presented in Supplementary Fig. S2. Data are presented as mean ± SEM of 3 independent differentiations (n = 3). Student’s t-test, *p < 0.05, and **p < 0.01. (C) Representative TEM micrographs showing the ultrastructure of lysosomes in healthy control (upper images) and PARK2 KO (bottom images) neurons. Scale bars: 1 µm, 100 nm. (D) Quantification of the lysosomal abundance relative to cytoplasm showing lysosomal accumulation in PARK2 KO neurons. (E) Lysosomal size, as a measurement of average area of the individual lysosomes, was increased in PARK2 KO neurons. (F) Mean Grey Value of individual lysosomes was reduced in PARK2 KO neurons. (G) Percentage of electron-lucent lysosomes among all lysosomes in a given neuronal population. Data are presented as mean ± SEM, n = 5–6 TEM grids, 3 independent differentiations (in total 45 TEM micrographs per cell line were analysed). Student’s t-test, *p < 0.05, and **p < 0.01.

