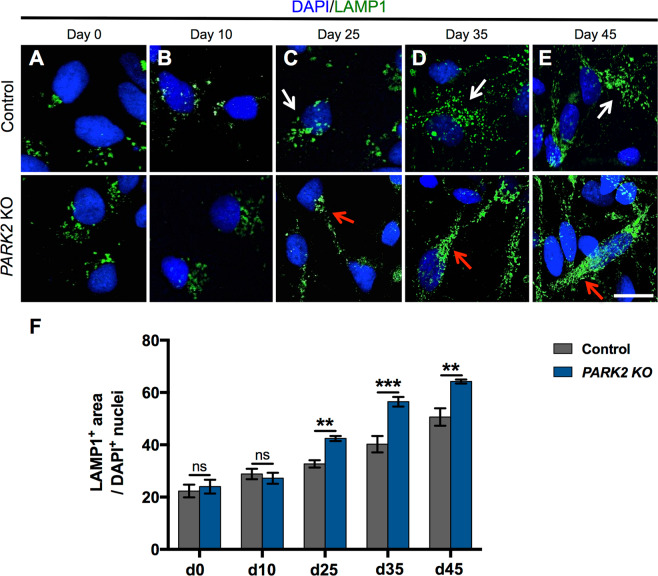
Figure 3.
Increased lysosomal area in mature PARK2 KO neurons. (A–E) Temporal changes in LAMP1 (green) immunoreactivity in iPSC-derived neurons from a healthy control and PARK2 KO cells. Cell nuclei were visualized using DAPI (blue). Scale bar: 20 µm. (F) Quantification of the area of LAMP1 + lysosomes normalized to the number of DAPI + nuclei showing no difference between PARK2 KO and control cells at days 0 and 10, and a significant increase at day 25 and later time points. Data are presented as mean ± SEM of 3 independent differentiations (n = 9). Student’s t-test, **p < 0.01, ***p < 0.001, ns: not significant.

