Figure 5.
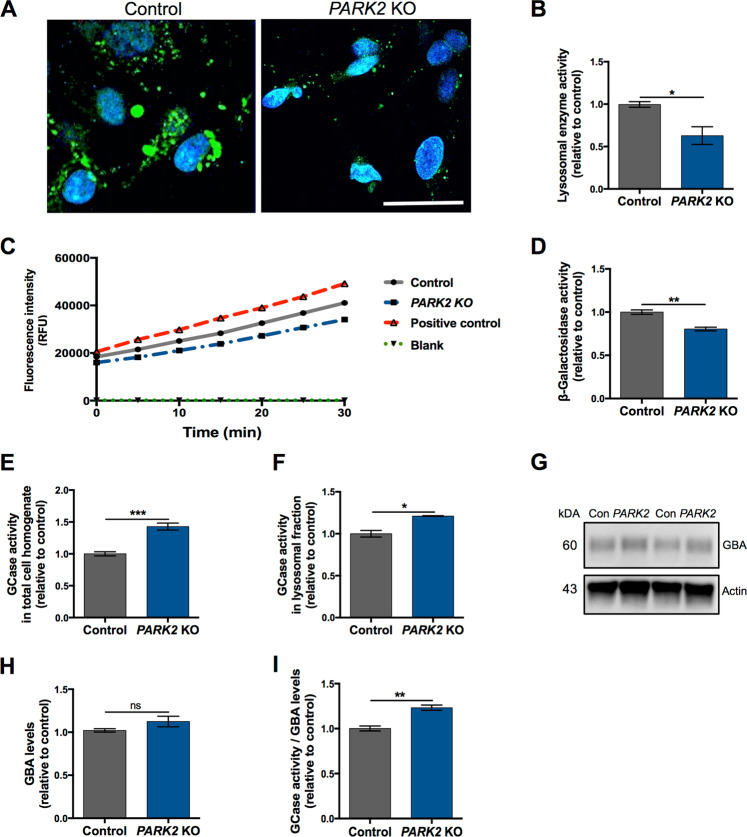
Perturbed lysosomal function in PARK2 KO neurons. (A) General intracellular lysosomal enzyme activity manifested by generation of the fluorescence signal in PARK2 KO and control neurons. Scale bar: 50 µm. (B) Quantification of the signal intensity showed a significant decrease in overall functional activity of lysosomal enzymes in PARK2 KO neurons compared to controls. (C) Kinetics of enzymatic activity of β-galactosidase (β-Gal) based on relative fluorescence intensity versus time. Graph represents changes in the PARK2 KO neurons (blue dashed line) and control neurons (grey solid line), positive control (red dashed line), and blank (green dot-dash line). (D) The specific β-Gal activity was significantly reduced for the PARK2 KO neurons. Data presented as ± SEM, n = 6, 2 independent differentiations. Student’s t-test, *p < 0.05, **p < 0.01. (E,F) Glucocerebrosidase (GCase) enzyme activity was significantly increased for PARK2 KO neurons compared to controls in both (E) total cell homogenate and (F) lysosomal fraction. (G,H) Western blotting showed no changes in GBA levels. Expression levels were normalized to β-actin and are shown relative to control neurons. Full-length blots are presented in Supplementary Fig. S3. (I) GCase enzyme activity normalized to GBA levels was significantly increased in PARK2 KO neurons. Data presented as ± SEM, n = 4–6, 2–3 independent differentiations. Student’s t-test, *p < 0.05, **p < 0.01, ***p < 0.001, ns: not significant.

