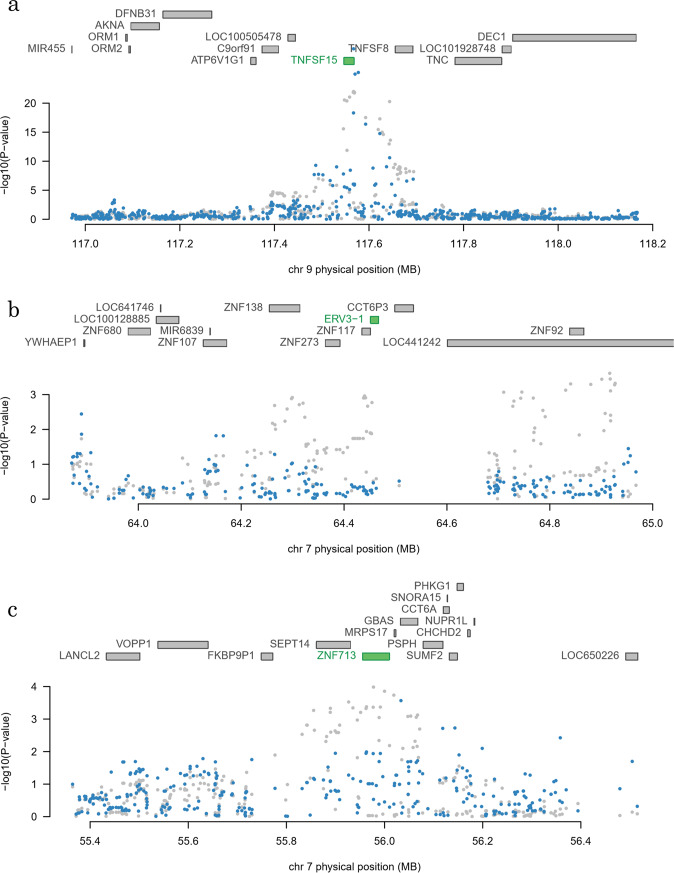
Figure 3.
Correlation plots of SNPs in regions that showed significant correlation by TWAS. Figure shows plots of polymorphism periphery of eight genes (a. TNFSF15, b. ERV3-1, and c. ZNF713) that showed significant correlation by TWAS. Each dot indicates -log10(p-values) before (gray) and after (blue) adjustment by gene (green) that showed correlation. ERV3-1 and ZNF713 lose correlation after adjusting by genes showing correlation, although the correlation of TNFSF15 remains.

