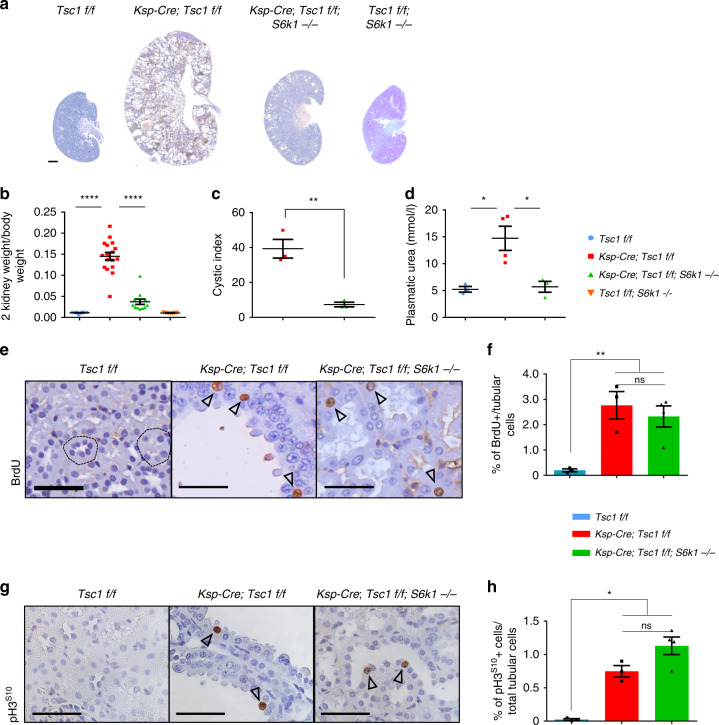
Fig. 1. S6K1 deletion protects from cyst formation in a mouse model of renal TSC without affecting proliferation.
a Macroscopic photos of BrdU staining at post-natal day 90 of the different genotypes indicated. Scale bar, 1 mm. b Kidney/body weight ratio of the indicated phenotypes at post-natal day 90. Mean ± SEM. n = 12 Tsc1 f/f, n = 17 Ksp-Cre; Tsc1 f/f and n = 12 Ksp-Cre; Tsc1 f/f; S6k1 −/− mice were quantified. c Cystic index – (total cystic area/total kidney area) × 100 – of mice of indicated genotypes. Mean ± SEM. n = 3 mice/group. d Plasmatic urea concentrations (mmol/l) were determined in the indicated genotypes at post-natal day 20. Mean ± SEM. n = 3 Tsc1 f/f, n = 4 Ksp-Cre; Tsc1 f/f and n = 3 Ksp-Cre; Tsc1 f/f; S6k1 −/− mice were quantified. e Representative pictures and f relative quantifications of BrdU staining at post-natal day 90 of the indicated genotypes. The percentage of BrdU-positive cells on the total number of tubular cells was counted in 10 different fields of each section. Dotted circles show transversal cuts of normal tubules. Empty arrows point at positive cells. Mean ± SEM. n = 3 Tsc1 f/f, n = 3 Ksp-Cre; Tsc1 f/f and n = 4 Ksp-Cre; Tsc1 f/f; S6k1 −/− mice were quantified n = 3 mice/group. Scale bar, 20 µm. g Representative pictures and h relative quantifications of pH3S10 staining at post-natal day 90 of the different genotypes indicated. The percentage of pH3S10-positive cells on the total number of tubular cells was counted in 10 different fields of each section. Empty arrows point at positive cells. Mean ± SEM. n = 3 Tsc1 f/f, n = 3 Ksp-Cre; Tsc1 f/f and n = 4 Ksp-Cre; Tsc1 f/f; S6k1 −/− mice were quantified. Scale bar, 20 µm. Source data are provided as a Source Data file.

