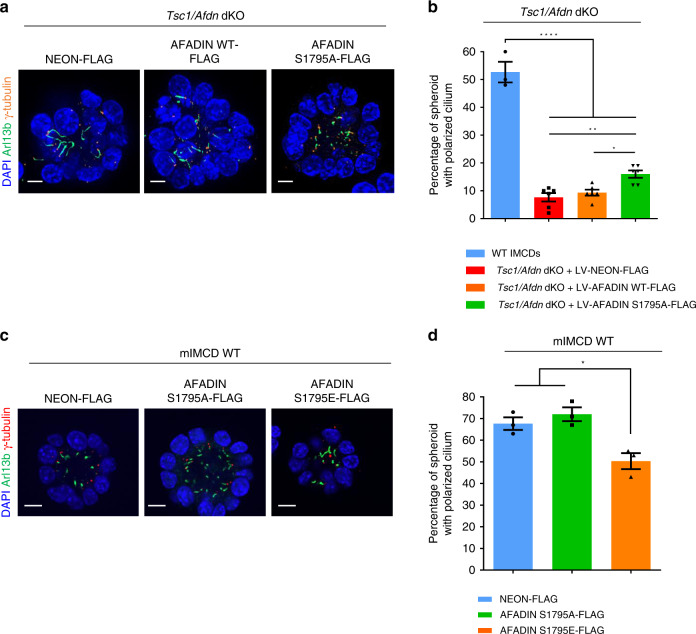
Fig. 8. Effects of Afadin phospho-mutants on sphere formation.
a Representative images of 5-day spheres from cells Tsc1/Afdn dKO transduced with lentivirus FLAG-Neon, FLAG-Afadin-WT, or FLAG-Afadin-S1795A. After fixation, spheres were immunolabeled with γ-Tubulin, Arl13b, and DAPI to quantify spheres with polarized centrosomes and primary cilia. Scale bar, 10 µm. b Quantification of the percentage of spheres with polarized primary cilia on total number of spheres from cells WT and Tsc1/Afdn dKO transduced with lentivirus FLAG-Neon, FLAG-Afadin-WT, or FLAG-Afadin-S1795A. The ratio was calculated on n = 70 spheres per experiment per each genotype. The histograms are an average of six independent experiments (for WT n = 3 independent experiments). Mean ± SEM. c Representative images of 5-day spheres from WT mIMCD cells transduced with lentivirus FLAG-Neon, FLAG-Afadin-S1795A (phospho-deficient) or FLAG-Afadin-S1795E (acidic phospho-mimetic). After fixation, spheres were immunolabeled with γ-Tubulin, Arl13b and DAPI to quantify spheres with polarized centrosomes and primary cilia. Scale bar, 10 µm. d Quantification of the percentage of spheres with polarized primary cilia on total number of spheres per genotype from WT mIMCD cells transduced with lentivirus FLAG-Neon, FLAG-Afadin-S1795A, or FLAG-Afadin-S1795E. The ratio was calculated on n = 70 spheres per experiment per each genotype. The histograms are an average of three independent experiments. Mean ± SEM. Source data are provided as a Source Data file.

