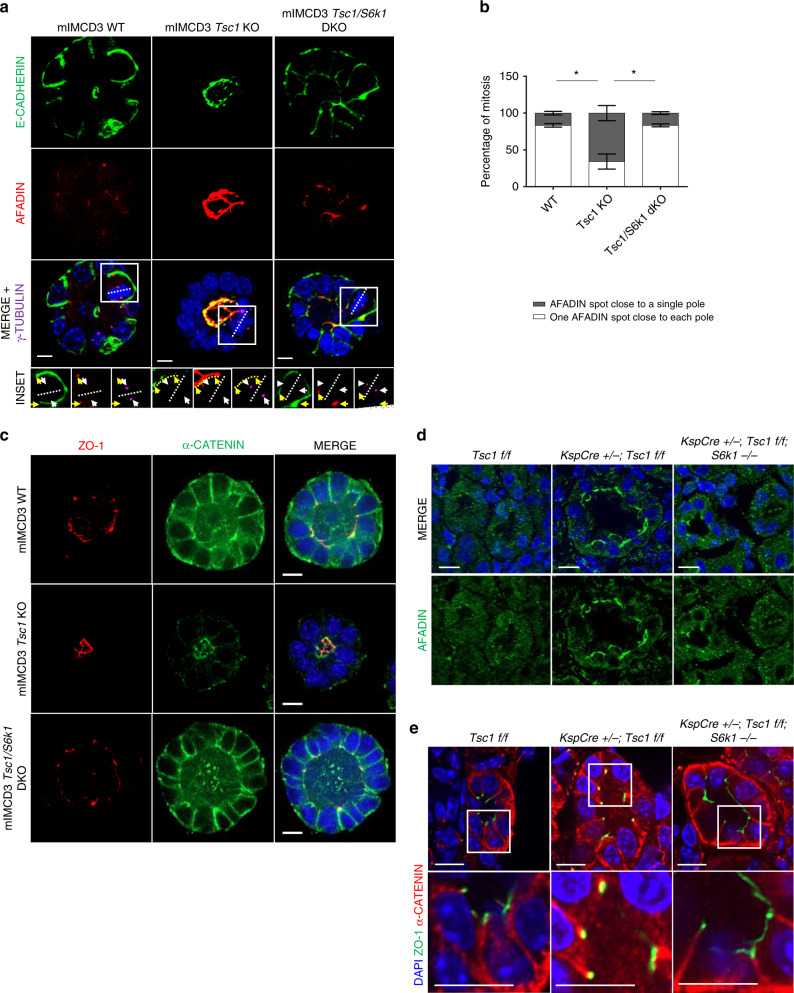
Fig. 9. Tsc1-deficient spheres display altered Afadin/Cadherin-based adhesion system localization.
a Representative images of 5-day mIMCD3s spheres of the indicated genotypes immunolabelled with Afadin (red), E-cadherin (green), γ-Tubulin (magenta) antibodies, and DAPI to show the relative localization of Afadin and E-cadherin in interphase and relative to the mitotic spindle poles in 3D spheroids. Insets show higher magnification of one mitotic cell per genotype, to show the relative localization of Afadin and E-cadherin in mitotic cells. In the insets, yellow arrows indicate the localization of the Afadin spots. White arrows indicate localization of the poles of the mitotic spindles. A dotted yellow line indicates Afadin staining in the whole apical domain of mitotic cells. Scale bar, 10 µm. b Percentage of mitosis showing one Afadin spot adjacent to each spindle pole (white), or perturbed afadin localization adjacent to a single spindle pole (dark gray). An average of 10 mitosis were analyzed per experiment per each genotype. The histograms are an average of three independent experiments. Mean ± SEM. c Representative images of 5-day mIMCD3s spheres of the indicated genotypes immunolabelled with α-catenin, ZO-1 and DAPI to show the loss of baso-lateral presence of α-catenin in the Tsc1 KO, with a concomitant appearance of an apical mislocalization relative to the apico-lateral marker ZO-1. Scale bar, 10 µm. d Representative pictures of pre-cystic post-natal day 20 mice, immunolabelled with Afadin antibody to show the localization of the protein in the indicated genotypes. Scale bar, 10 µm. e Representative pictures of pre-cystic post-natal day 20 mice, immunolabelled with α-catenin, ZO-1 and DAPI to show the localization of the proteins in the indicated genotypes. Source data are provided as a Source Data file.

