
Fig. 5. Demographic history of R. ferrugineus.
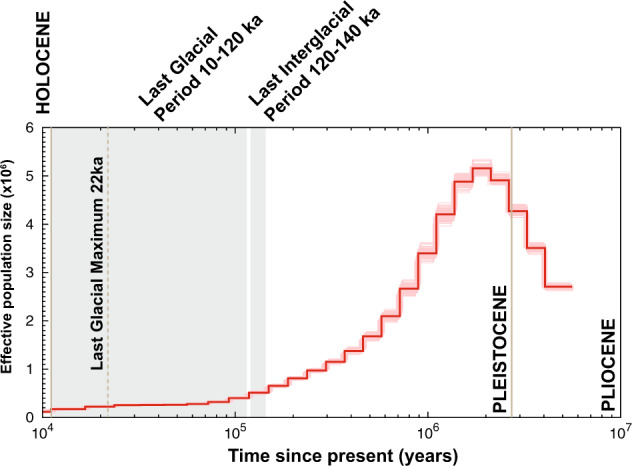
PSMC analysis was applied on the genomic sequences of R. ferrugineus converted to demographic units assuming a generation time of 4 month (g = 0.3 years) and a substitution rate of µ = 0.89 × 10⁻¹⁰. The x axis represents time before present in years in log scale and the y axis is the effective population size. The bold red curve shows the estimate of the original data and the shaded red curves are estimate for 100 bootstrapped sequences.